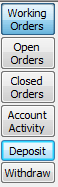
The Accounting Simulator Expansion Pack helps you keep track of your profits and losses, simulate trading, and perfect your trading strategy. You will be able to view your open and closed orders, your account activity, and keep track of your broker fees and pip spreads. The Accounting Simulator Window will be on the bottom of your screen, below the Chart Window. The buttons on the left of the Accounting Simulator Window are referred to as your Accounting Control Panel, see below.

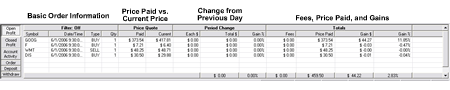
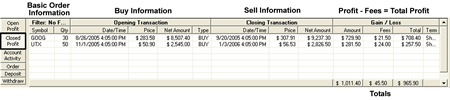
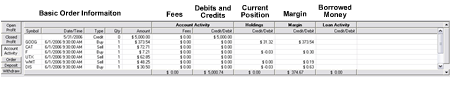
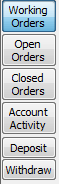 Once you have open orders that have filled, they will show up under the Open Profit button. The Closed Profit button will show all closed orders, and the Account Activity button shows all of your account activity from deposits and withdrawals to open and closed orders. The Order, Deposit, and Withdrawal buttons below pull up screens that help you place orders, make deposits, and create withdrawals. Using the Accounting Control Panel, it is easy to see where you stand as far as your profits and losses. You can also view specific information as the screenshots below demonstrate.
The following Simulation Tools will help you simulate your trading experience on your chart.
 |
Buy/Sell: Select and left-click in chart to place stop order, right-click to place limit order. |
| Autofollow Mode: (Green) Plays your open charts with incoming data. Simulation Mode: (Red) Activates Play Controls |
|
| Play to Date: Play all charts to a certain date. | |
 |
Beginning: Moves to the first day in the chart. |
| Reverse Step 28: Moves back 28 price bars and stops. | |
| Reverse Step 1: Moves back 1 price bar and stops. | |
| Rewind: Plays chart backwards quickly. | |
| Play: Plays chart backwards one tick at a time. | |
| Stop: Stops any play buttons. | |
| Play: Plays chart forward one tick at a time. | |
| Fast Forward: Plays chart forward quickly. | |
| Step 1: Moves forward 1 price bar and stops. | |
| Step 28: Moves forward 28 price bars and stops. | |
| End: Moves to the last day in the chart. |
Think of your Accounting Simulator as a bank account. You need to deposit money before you can use it. You can also withdraw money when you would like, or you may need to deposit more money if you spend what is already in your account. The first thing you will need to do is make a deposit.
 To make a deposit, click on the Deposit button on the Accounting Control Panel.
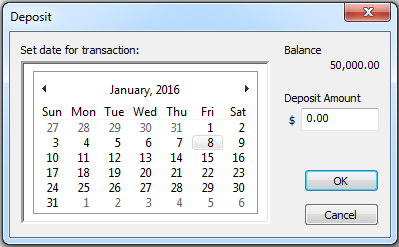
The Deposit window will appear. The date on this screen will be the same date your chart has played to. To change the date of your deposit, click on the arrows to go forward or backward by month, then click on the day of the month. Under amount, enter the dollar amount you want to deposit.
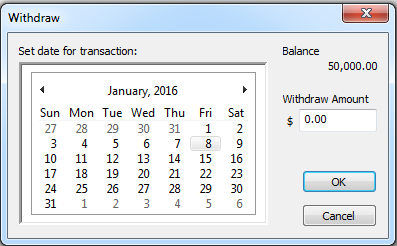
 To make a withdrawal, the screen is the same as above, and the procedure is the same. The only difference will be that money will be taken out of your account instead of adding to it.
Now that you have money in your simulated account, you can start placing orders. There are two ways to place an order. You can click on the Buy/Sell button on the Simulation Toolbar then on the chart where you want to place your order. The Account tab will open in your control panel with the order placement box filled out with the correct information:
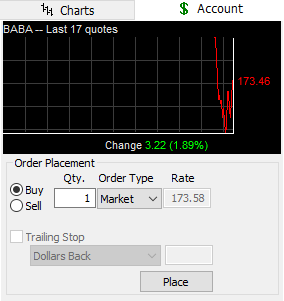
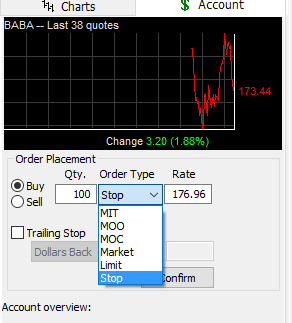
Order Placement: Choose to "Buy" or "Sell," then the quantity, the order type (see the list of definitions for each order type in this section), and the price at which you want your order to be filled. Once your order is placed, it will not show in your Accounting Simulator until the order is filled.
Trailing Stop: This can only be used on a Stop Order. Check the box to use a Trailing Stop on your order. Your Trailing Stop will follow an open position and protect profits by trailing a market rise or decline. You can choose to set your Trailing Stop by Dollar amount, Price Bars Back, or by following the PSAR or Zig Zag Indicators.
*If you have purchased the Bulls' n Bears Trading System then you will also have the option to follow the BNB Blue Light.
A trailing stop is a feature that helps you protect profits. As opposed to a Stop Loss order that is set to a certain price, a Trailing Stop moves with the market and follows an order, changing it's price as it follows the parameters set in the order. Track 'n Trade will watch each of your positions. Each time one of your long positions goes up, Track 'n Trade adjusts your Trailing Stop according to the setting you set at the time you placed your order. If the prices moves back down a predetermined amount, you will hit the trailing stop, and the order will automatically sell your shares. Short positions work the same way, but the direction is reversed.
 Stop Order - Place a buy stop order above the market price; place a sell stop order below the market price. A stop order becomes a MARKET ORDER when the specified price is reached. Track 'n Trade fills these orders at the specified price if the price is within the trading range of the fill date, or at the opening price of the fill day.
Market Order - A market order does not specify a price, it is executed at the best possible price available. A market order can keep you from "chasing" a market. Track 'n Trade fills these orders at the opening price of the next day's trading.
(MOO) Market On Open - This is an order that you wish to be executed during the opening range of trading at the best possible price obtainable within the opening range. Track 'n Trade will fill these orders at the opening price of the next day's trading.
(MOC) Market on Close Order - Market On Close orders will be filled during the final minutes of trading at whatever price is available. Track 'n Trade will fill these orders at the closing price of the next day's trading.
(MIT) Market If Touched - Similar to a limit order, orders to buy are placed below the current price; orders to sell are placed above the current price. MIT orders fill once the limit price is touched or passed through. Track 'n Trade will fill limit orders at the limit price on the day your order fills if that price is in the trading range, or at the opening price of that day.
Limit Order - Limit Orders to buy are placed below the current price; limit orders to sell are placed above the current price. The market may touch a limit price several times without filling. In most cases, the market must trade BETTER than the limit for the order to fill. Track 'n Trade fills limit orders when the market trades BETTER then the limit price.
You have the ability to edit an order and change the properties by right-clicking on the order.
Right Click on the order you want to edit and the window will appear. Enter your changes in the top portion of the screen, which is a copy of your original order screen (see Placing an Order paragraph for details). The bottom half of the screen is a history of the order, which can not be changed.
The option to cancel an order is only shown when an order is not filled. An order cannot be canceled until after it is filled, it can only be deleted. Canceled orders will still show on your chart, but will have an X through them. Deleted orders will completely disappear from the chart.
Restore Settings: Click on "TNT Default" if you would like to see or restore original software settings. Click on "My Default" to return to your personalized default settings. Click on "Apply To All Charts" if you would like to see your selected settings on all open charts. Click on "Save As My Default" to save your personal settings. All charts opened from the time you save your settings will have those specific settings applied to them.
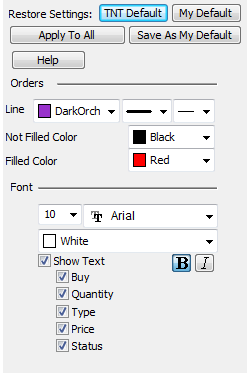
Line: Choose the color, style, and thickness of the line.
Not Filled/Filled: Choose the color of the arrow on your order for each status.
Font: From here you have the ability to change the size, font, and color of the text.
Show Text: Check box if you want the order text to show on your chart.
You can view your orders in the Charts tab of your Control Panel. Under the Position label, you will see an arrow and a number. The number accounts for how many orders you have in the market. The arrow will be red or green and pointing up or down.
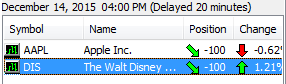
Red: You are losing money
Green: You are making money
Up: You are going long
Down: You are going short