
Use the Dollar calculator to find the dollar value between two points on the chart. Select the Dollar calculator tool from your Calculators toolbar. Click on your chart where you want the calculator to start and drag to where you want the calculation to be completed. Release the mouse button to place. The dollar amount of the chart movement will be calculated from the beginning and end point values and will be displayed in the center of the line.
Select the drawing by clicking on it. You will know the drawing is selected when boxes appear at the corners. Click on a box and drag it to your desired location. Release the mouse button to place.
Select the drawing by clicking on it. Hold down the mouse button and drag to the new location. Release the mouse button to place.
Select the drawing by clicking on it. Press the Del (Delete) key on your keyboard. You can also right-click the channel and select "Delete" from the drop-down menu.
Select the dollar calculator by clicking on it. The properties will appear in the preferences section of your control panel. Or you can right click on a drawn dollar calculator tool and select Properties.
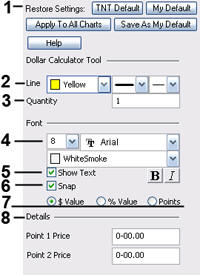
1. Restore Settings: TNT Default will change your settings back to the original software settings. My Default will change current settings to your personalized default settings. Apply To All Charts will apply your selected settings on all open charts. Save As My Default will save your current personal settings.
2. Line: Choose the color, style, and thickness of the line.
3. Quantity: Shows the number of shares/contracts included in the calculator transaction. Select and type the desired quantity to change the value.
4. Font: From here you have the ability to change the size, font, and color of the text.
5. Show Text: Uncheck this box to hide the text.
6. Snap: Select this option to place the circle directly on a price bar. You can snap to open, high, low, or close.
7. Value / % Value / *Pips *fx only: In Track n’ Trade Live Forex you can choose to display the dollar calculator as a $ Value, % Value, or as Pips.
8. Details: This section gives you the price value of Point 1 and Point 2 on the Dollar Calculator. You can modify these values by highlighting and typing a new value.

The Risk/Reward calculator is used to find the difference between two points of the risk and reward zone. Select the Risk/Reward tool on your Calculators Toolbar. Click on your chart where you want your technical formation to begin and drag to cover the area between your initial order and your risking stop loss order.
The calculator will create an equal-sized reward area that can be stretched to the proper distance you expect the graph to retrace. The numbers in the tool indicate the dollar amount of risk and reward.
When the chart is trading within the risk area (negative number), you are risking your own money. When the chart is trading within the reward area (positive number), you are risking OPM or "Other People’s Money." Use the Risk/Reward calculator on all trades to calculate where your order entries and exits should be placed.
Select the drawing by clicking on it. You will know the drawing is selected when boxes appear at the corners. Click on a box and drag it to your desired location. Release the mouse button to place.
Select the drawing by clicking on it. Hold down the mouse button and drag to the new location. Release the mouse button to place.
Select the drawing by clicking on it. Press the Del (Delete) key on your keyboard. You can also right-click the channel and select "Delete" from the drop-down menu.
Select the risk vs. reward by clicking on it. The properties will appear in the preferences section of your control panel. Or you can right click on a drawn risk vs. reward tool and select Properties.
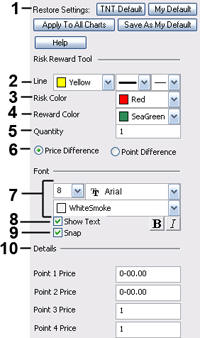
1. Restore Settings: TNT Default will change your settings back to the original software settings. My Default will change current settings to your personalized default settings. Apply To All Charts will apply your selected settings on all open charts. Save As My Default will save your current personal settings.
2. Line: Choose the color, style, and thickness of the line.
3. Risk Color: Change the highlight color of the Risk text.
4. Reward Color: Change the highlight color of the Reward text.
5. Quantity: See Dollar Calculator Preference Tab.
6. Price/Point Difference: Either view the Point or Price difference of the risk and reward calculator.
7. Font: Change the size, font, and color of the text.
8. Show Text: Uncheck this box to hide the text.
9. Snap: Select this option to place the circle directly on a price bar. You can snap to open, high, low, or close.
10. Details: This section gives you the price value of Point 1 and Point 2 on the Risk/Reward Calculator.