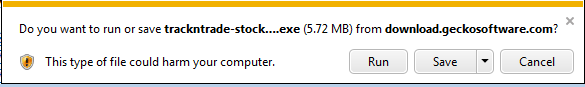
When you first download the program this window will appear.
-Click Save
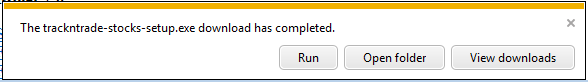
Next you will see the Open File Window.
-Click Run
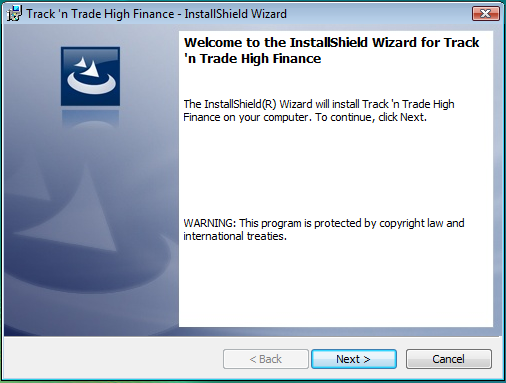
The Track 'n Trade High Finance Installation Wizard window will appear. This will guide you through the installation process.
-Click Next
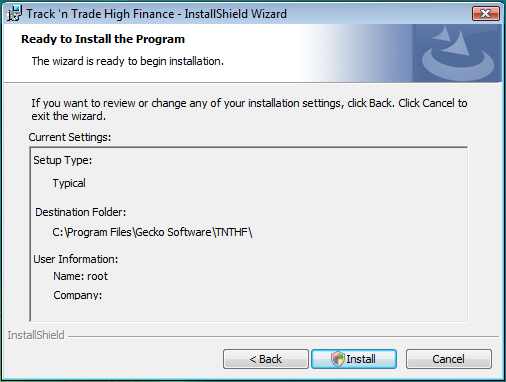 Next you will have to confirm your installation.
-Click Install
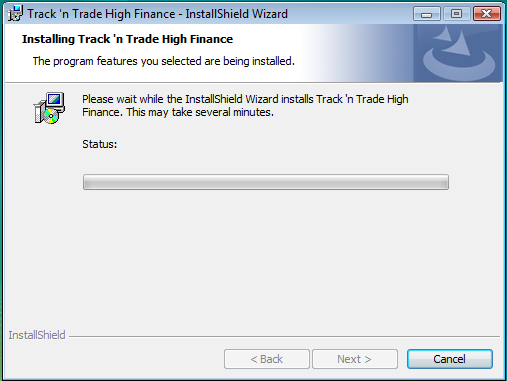
An installing screen will appear. This may take a few minutes.
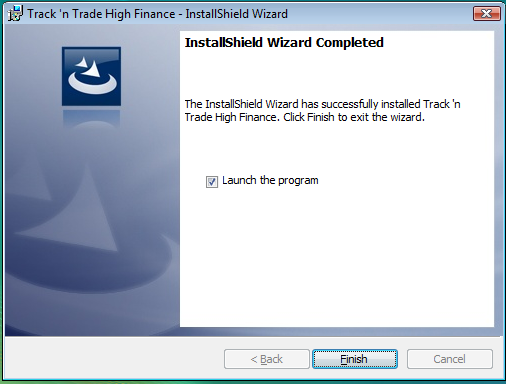
Once installation is complete this window will appear.
-Click Finish
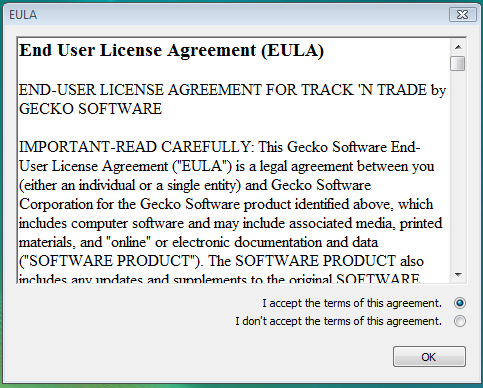
Please read the End User License agreement and if you agree to the terms of use.
-Agree to terms by selecting the button next to I accept
-Click OK
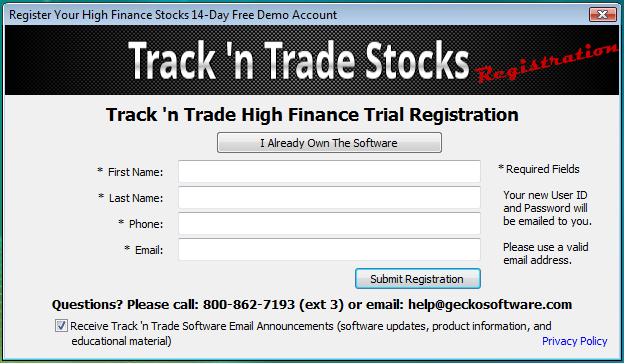
Here you will enter your personal information.
-All fields are required for trial software registration.
-Click Submit Registration
The start up screen will appear next. This is the screen you will see when you start up Track 'n Trade High Finance. To open the software, enter your email address and password into the fields provided and click Connect.
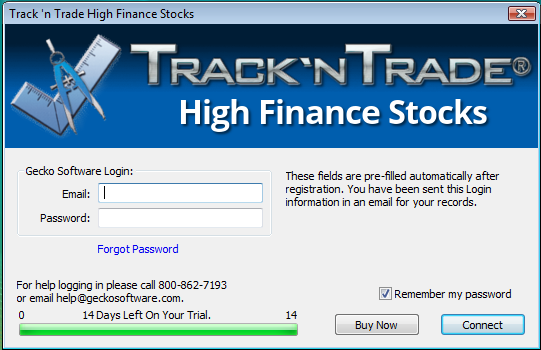
The option to Remember my password is available in Track 'n Trade High Finance. Remember, logging-in gives you access to your financial information through Track 'n Trade High Finance. Be aware that others may use these saved passwords and access this information.
The Account Manager was created to give Gecko Software customers a convenient resource to update their personal information with us, such as your billing, shipping, and payment information.
To access the Account Manager, log-in to Track 'n Trade High Finance, click on the Help Menu, and select Account Manager. The Account Manager will open in your default browser. (You will not need to enter your email address and password if you are already logged-in to the program.)
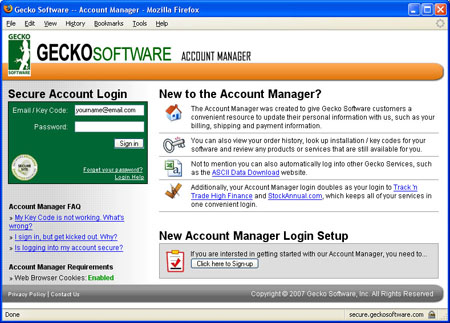
Or, access your Account Manager by visiting www.trackntrade.com [2] or www.geckosoftware.com [3] and click on Account Manager. To log-in to the Account Manager, use the same email and password you use to access Track 'n Trade. There are links below the log-in to help you in case you forget this information. If you do not have a password, click on the "Click Here to Sign-Up" button on the bottom of the screen. It is helpful to read the information given here.
Once you have logged in, a screen will appear with your information on it. The top of the screen is a menu with Home, Update Account, Order History, and Available Products tabs.

From the Home page you can view your Account Details at the top left corner, which include your current address and phone number. You can change this information by clicking Review. You will also see any Account Notices, such as a notice that one of your subscriptions needs to be renewed. Below will be a list of your current subscriptions and a list of the software programs you currently own.
The Update Account page is where you can update your Billing and Contact Information, Shipping Information, Payment Information, and your Password. It is important to keep this information up-to-date.
On the Order History page, there will be a chronological list of all your orders. To view them in detail, click on the Details link on the right side of the screen.
The last page on the menu is Available Products. Here you can view all the Gecko Software products you do not own. Please browse through and make purchases from this window.
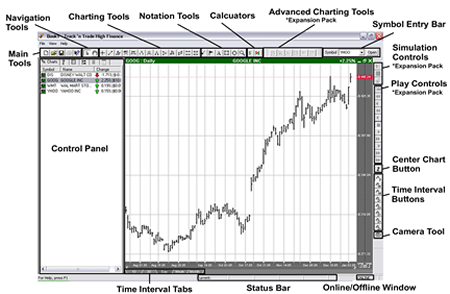
This section will introduce you to the basic functions and features of Track 'n Trade High Finance. First we'll take a look at your workspace. The screenshot below is what you will see when you open Track 'n Trade High Finance. Use this as a reference for the rest of the manual. The following pages will go into further detail of the functions of each Toolbar and Menu you see here.
 New: Closes the chartbook that is open and creates a new blank chartbook.
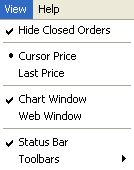 Hide Closed Orders: Hides any orders that have been closed.
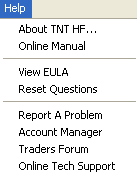 About TNT HF: Shows the version of Track 'n Trade High Finance installed.
Each toolbar can be customized to fit your trading needs. To customize a toolbar, place mouse over the toolbar and right click, then select Customize Toolbar.
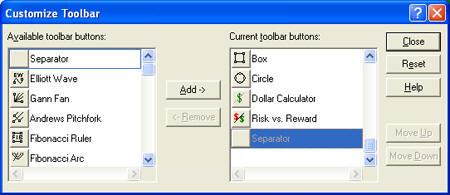
To add buttons, select desired buttons and click Add. To delete unwanted buttons, select and click Remove. To restore default buttons, click Reset. When you have made your changes, select Close to save your changes and return to the program.
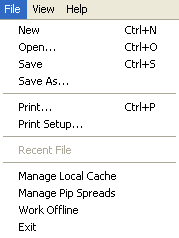
New: Closes your current chartbook and opens a new chartbook. Open: Closes your current chartbook and opens a window for you to choose a previously saved chartbook. Save: Saves your open charts as a chartbook. Print: Prints the Chart Window. Help: Click on this button, then click anywhere in the software to learn more about that feature.

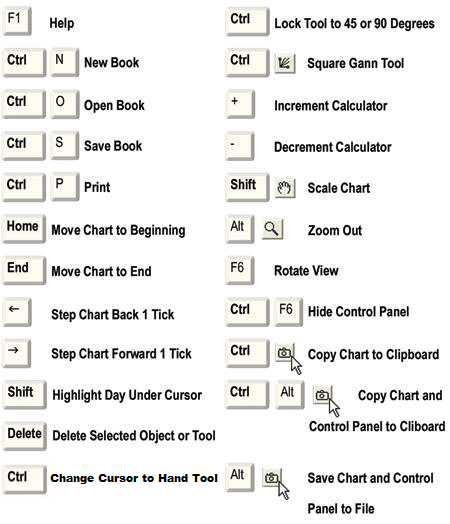
Pointer: Default tool used for selecting tools and features in the software. Magnifier: Used to zoom in on a section of your chart. You can click and drag to select an area to zoom in on or simply click on the center of the chart to zoom in. To zoom out, hold down the Alt key and click on the chart. Hand: Scrolling tool used in chart window. Click and drag a chart to scroll.

Crosshair Tool: Used to draw a line vertically and horizontally on a chart. Line Tool: Used to draw support and resistance lines. Multi-Line Tool: Used to draw an alternating support and resistance line. Arc Tool: Used to illustrate a rounded top or bottom formation. Day Offset Tool: Measures the number of trading days vs. actual days that are between two points. 123 Tool: Used to chart a 123 top or bottom formation. Head & Shoulders Tool: Used to chart a Head & Shoulders top or bottom formation. Dart/Blip Tool: Used to chart a Dart/Blip up or down formation. Wedge Tool: Used to identify any type of wedge or triangle. Trend Fan Tool: Used to identify a Trend Fan. Trend Channel Tool: Used to identify an inclining or declining channel. Horizontal Channel Tool: Used to identify a horizontal channel. N% Ruler: Used to measure a retracement. Default is 50%.
Arrow Tool: Used to draw arrows to help point out areas of interest. Flag Tool: Used to place a flag or graphic. Text Tool: Used to type text. Box Tool: Used to draw a box. Circle: Used to draw a circle.

Dollar Calculator: Used to find the dollar value between two points on the chart. Risk/Reward: Used to find the difference between two points of the risk and reward zone.
The Advanced Technical Tools only appear if you have the Advanced Technical Tools Expansion Pack, which includes the Elliott Wave Tool, the Gann Fan Tool, the Andrews Pitchfork Tool, the Fibonacci Ruler, the Fibonacci Arc Tool, and the Fibonacci Time Zones.
 Daily Chart: Each price bar represents a day.
Weekly Chart: Each chart price bar represents a week.
Monthly Chart: Each chart price bar represents a month. The following buttons are integrated with the Time Interval Tabs found on the bottom of a chart at full screen.
Screen Capture: Saves your open chart as an image. Holding down Alt while you click this button will save the chart and control panel to file. Ctrl-click will copy the screenshot to your clipboard (making it ready to paste). Ctrl-Alt-click will copy your chart window plus your control panel to your clipboard.
The Track 'n Trade Control Panel is on the left side of your screen. It includes six tabs: Charts, Account, Reports, Preferences, Data, and Notes.
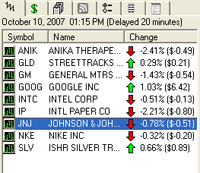 In the Charts Window you will see all the symbols you have opened, the name of the chart, and the change in price of that chart since it opened. To view a specific chart at full screen, double click on the symbol in your Charts Window, or right-click on the symbol and select Open Chart. To delete a chart select it in your Charts Window and hit the delete button on your keyboard, or right-click on the symbol and select Delete Chart. The more charts you open, the slower your computer will run. Note: If you find your computer running slow, you may need to break your charts into two or more chartbooks.
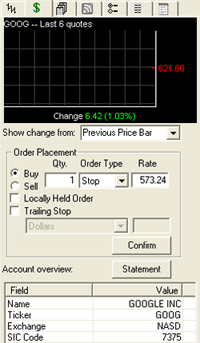 The Chart Quote Window shows a history of quotes. Customize this window by adjusting the Show Change Form to show the change from the Previous Price Bar, Previous Day, or Previous Quote. Order Placement: Displays details of the order you are placing. The time, date, and market you are buying are determined by the date your chart is played to and what market you have open. Once your order is placed, it will not show in your Accounting Simulator until the order is filled. Locally Held Order: This type of order is temporarily held locally at your computer. It is only sent as an actual order when the markets meet the proper conditions of your order. Locally held orders are only available in the Forex version of Track 'n Trade. Trailing Stop: You can only select this option on a Stop Order. It will follow an open position and protect profits by trailing a market rise or decline. You can choose to set your Trailing Stop by Dollar amount, Price Bars Back, or by following the PSAR or Zig Zag indicators. Account Overview: View a detailed overview of your current symbol. Includes the ticker symbol, exchange, open/close data, and much more. The account Statement button will give you access to a detailed tabulation of your account history.
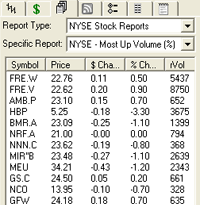 Under Report Type, select the Exchange you would like to get a statistical report from. Then select the statistical report you are interested in under Specific Report. There are 10 reports available that highlight different statistical findings. For example, you can select to see the most actively traded market that is trading higher or lower, or bring up the market that is creating the most news. The information is based on the current day's trading information.
 The Preferences Tab will help you customize how your chart, and information on it, looks. It will also show the options for customizing Technical Tools and Indicators. There are many different features found on the Preferences Tab.
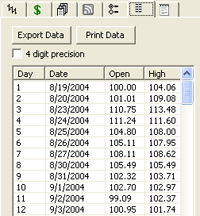 The Data Tab will give you the historical data for each day a specific symbol has traded. It will give you the open price, close price, highest price, and lowest price on the day. It will also show the volume traded. You have the option to print the data for your records, or export the data for use another way. Also, values for indicators are added when the indicator is open.
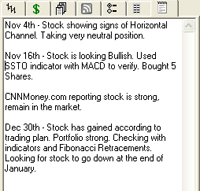 The Notes tab is for your convenience to use as a note pad for your research and trading strategy. A separate note pad is provided for each chart.
Just like a novel is made up of many single pages, a chartbook contains many individual charts. Each chartbook can contain several charts, each individual chart becoming the "pages" of your chartbook. Every time you open Track 'n Trade High Finance, a blank chartbook named Book1 will open. You can either continue with this new chartbook or open a chartbook that has already been saved.
To open a chart, type in the symbol in the Symbol Entry Bar or click on the arrow to the right of the box and select from the dropdown menu. If you do not know the symbol of the market you want to see, select Look Up Keyword for stocks or type in the Forex Market and click Open for Forex.
You can open multiple charts and view them at the same time. The charts will automatically adjust to fit into your Chart Window. Opening too many charts can slow down your computer. If you notice slow downs in your system you may want to break up your charts into two chartbooks or more.
To maximize a chart, double-click on the name of the chart in the Control Panel, or select the maximize button on the top right hand corner of the chart.
To restore the chart to full screen view in your chart window with multiple charts open, click on the restore down button on the top right hand corner of the chart.
To minimize a chart, select the minimize button on the top right hand corner of the chart. This will not delete your chart or any notations or tools you have placed on it. It will only eliminate it from your chart window.
To restore your chart, double-click on the name of the chart in the Control Panel charts list.
To close a chart and remove it from your list of charts, click the X on the top right hand corner of your chart. This will delete any notation or technical tool you have drawn on the chart.
Once you have opened all the charts you would like to save in a Chartbook there are two ways to save it. (1) You can click on the Save button found in the Main Tools, or (2) you can choose File from the Menu Bar and select Save.
To save over or replace a Chartbook that has already been saved, select Save As from the File Menu, and select the chartbook you want to save over.
To print your Chart Window, select the Print button in your Main Tools, or select Print from the File Menu. To print only one chart, maximize it in your Chart Window, then select print.
The Chart Preferences Tab is used to control how your chart looks. You can change your price bar style and color, background color, scaling, and even control time intervals. You can also choose to have different styles for each chart, or apply your favorite chart style to all your charts.
The Charting Preferences Tab is located on the Control Panel. To view the Charting Preferences Tab, right-click on the chart and select Chart Preferences, or click on the Preferences Tab in the Control Panel. The Charting Preferences Tab includes Chart Scaling, Ruler Options, Charting Colors, Price Bars, and Onscreen Indicators.
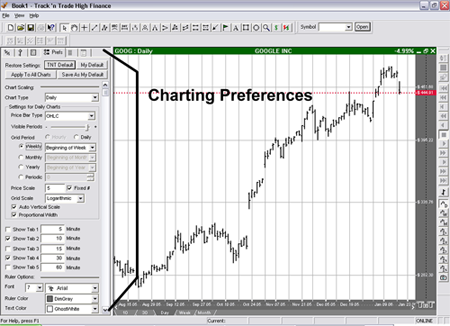
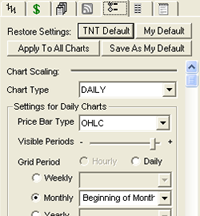
TNT Default will change your settings back to the original software settings. My Default will change current settings to your personalized default settings. Apply To All Charts will apply your selected settings on all open charts. Save As My Default will save your current personal settings.
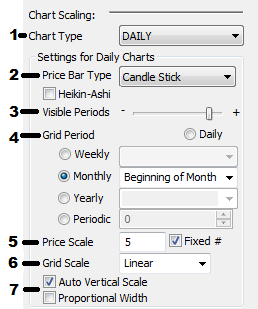 1: Chart Type: Sets the time interval each price bar will represent. You will have different grid options depending on what chart type you choose.
2: Price Bar Type: Choose what information you want your price bar to include.
3: Visible Periods: Scaling tool to make the chart wider or narrower to view different sections of time periods.
4: Grid Period: Sets vertical grid lines at specific intervals. For example, if you have selected a 5, 10, 15, 30, or 60 minute chart type your grid period settings will be limited to hourly, daily, or periodically. However, if you select a daily, weekly, or monthly chart type your grid period settings will be open to selecting any day of the week or month. You can also set your grid line to show daily, or at the beginning of each month, as well as selecting to show them periodically, as shown on the previous page.
5: Price Scale: Sets the amount of horizontal price grid lines you see on your chart, these are equally spaced. If you want to see price grid lines at set intervals, uncheck Fixed, then select what price increments you want your grid.
6: Grid Scale: Linear will keep your grid lines evenly distributed. Logarithmic will continually decrease the amount of space between horizontal grid lines as the price goes up.
7: Auto Vertical Scale keeps the price bars vertically centered on your chart. Proportional Width changes price bar thickness according to scale
Heikin-Ashi:
This price bar analysis method is used by traders to better identify trending markets and patterns. This technique will alter the Open/High/Low/Close of price bars viewed on the chart. The close will be determined by an average of the OHLC values as opposed to the actual market closing price for each bar. The open is determined by averaging the open and close of the previous price bar.
Heikin-Ashi may be activated from the Charting Preferences tab.
Calculation
Close = (Open+High+Low+Close)/4
Open = [Open (previous bar) + Close (previous bar)]/2
High = Max (High,Open,Close)
Low = Min (Low,Open, Close)
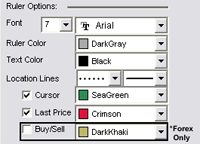 Font: Change the font and size of the text on the ruler.
Ruler/Text Color: Change the background and text color of the ruler.
Location Lines: Change the line style and thickness of your ruler lines.
Cursor, Last Price, Buy/Sell: Select if you would like to see location lines, a last price line, or buy or sell prices on your chart and what color.
The Charting Colors section changes the look of your chart by allowing you to change the background color of the chart and letting you change the color of the horizontal and vertical grid lines.
The price bars, or tics, on your chart can be colored in two different ways. You can select Close to shade them according to their close price, or you can select Alt Days (alternating days) to shade them by odd and even days. In the Highlight section, you have the choice of highlighting the price bar you are over, or highlighting the entire day you are over.
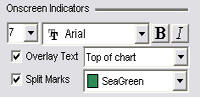 In the Onscreen Indicators section, you have the ability to change the font, size, and style of the text displayed onscreen. Click on the Overlay Text checkbox to display text for an indicator on your chart, then choose whether you would like the text to appear at the top or bottom of the chart. Also, check the Split Marks box if you would like those points displayed on the chart. Split Marks show when a market is split into two markets. Choose your desired color for the split marks as well.
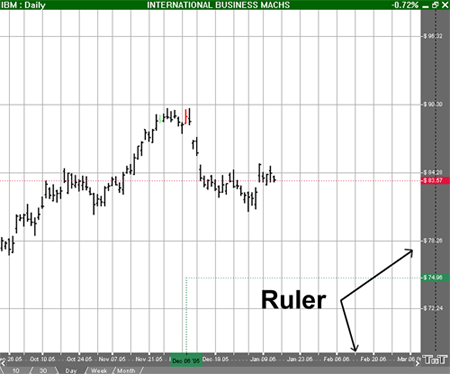
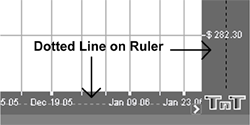 On your ruler you will see a dotted line splitting it in half. If you want to move your chart horizontally or vertically, click and drag the section of the ruler bar closest to the chart. To scale your chart horizontally or vertically, click and drag the section of the ruler bar farthest from the chart.
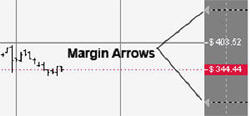 On the Ruler Bar you will notice four Margin Arrows, two on the right ruler, and two on the bottom ruler. These arrows are used to center your chart within these "margins." To move the margin click on the arrow, continue holding down the mouse button, and drag to the new location. Then click on the center chart button to resize the chart.
The right-click menu is a shortcut to customize your chart, add overlay indicators, add indicator windows below your chart, and change other features. Make sure your pointer is selected on your navigation menu, then select the chart and right-click. The following menu will appear.
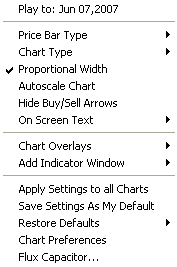 Play to: Date: Your cursor should be in line horizontally with the date you want the chart to play to. Select this option and the chart will either erase price bars to the date or play price bars up to the date you have selected. Choose what Price Bar Type you would like to view.
Chart Type will change the time intervals.
Proportional Width will make your price bar width proportional to the scale of your chart. Autoscale Chart will center your price bars within the height of your chart. Hide Buy/Sell Arrows will show or hide your arrows for the indicator selected. Choose to show your On Screen Text and where you want it to appear.
Select which Chart Overlays you would like to appear on the chart. Or if you would like to Add Indicator Window at the bottom of your chart window.
Apply Settings to all Charts will apply your selected settings on all open charts. Save Settings As My Default will save your current personal settings. Restore Defaults will change your settings back to the original software settings or to your personal saved settings.
Chart Preferences: Select to display the Chart Preferences Tab to the left of your chart.
Links
[1] https://secure.geckosoftware.com/account_manager/
[2] http://www.trackntrade.com
[3] http://www.geckosoftware.com