
The introduction for stocks provides basic terms and concepts about the stock market in general.
Equity security is the formal term for stock in a publicly traded company. When you hear the word "equity" it means ownership, which is what a share of stock represents. Similarly, bonds are always equated with the word "debt." The word "security" references either stocks or bonds. It is defined as the evidence of ownership in the case of stocks, and evidence of debt in the case of bonds. Thus, stocks are an equity security while bonds are a debt security.
There are three types of stocks: common, preferred, or convertible. As the name says, common stock is the most common type of equity security. The term common stock is used for any equity security that has no special dividend rights and has the lowest priority claim in the event of bankruptcy. Owners of preferred stock, in contrast, usually receive preferred treatment when it comes to receiving dividends of cash payoffs in bankruptcy. There are also convertible securities that start as one type but can be converted into another if the investor desires. Most convertible securities are preferred stock or bonds that are convertible into common stock.
Common stock represents a basic ownership claim in a corporation. Think of this as the investors who have put up investment capital to get things going, just like if you decided to invest in the creation of a business in the town or city that you live. Whoever starts the company can sell partial ownership of it in order to capitalize, or raise money for company growth.
The most important thing about common stock is that it represents a residual claim against the corporation's cash flows or assets. In other words, if the company goes bankrupt, shareholders have a legal right to repayment in bankruptcy court. However, common stockholders are last in line. All prior debts must be paid to the employees (wages), the government (taxes or judgments), short term creditors (banks), bondholders (long term lenders), and preferred shareholders (owners). The common stockholders get whatever is left, the residual value of the firm. Therefore, the value of common stock is directly related to the company's profits.
Legally, common stockholders enjoy limited liability, meaning that their losses are limited to the original amount of their investment when they bought their common stock. For example, the Bhopal Disaster of 1984 is considered to be the worst industrial disaster in history. It was caused by the accidental release of 40 tons of methyl isocyanate (MIC) from Union Carbide India Limited, a pesticide plant located in the heart of the city of Bhopal, India. The accident, in the early hours of December 3, 1984, produced heavier-than-air toxic MIC gas which rolled along the ground through the surrounding streets killing thousands outright. The gas also injured anywhere from 150,000 to 600,000 people, of whom at least 15,000 later died. Heads rolled at the corporate level in the aftermath, but none of the common or preferred shareholders stood to lose more than the initial investment they made when they purchased the company stock.
A dividend is a portion of a company's profits that is paid to its stockholders. Common stock dividends are not guaranteed, and are often irregular or even non-existent. Dividends are always paid from the company's after-tax cash flows. Because dividend income is taxable for most investors, dividends are double taxed – once when the company pays the corporate income tax on its profits, and once more when the investors pay their personal income taxes. To avoid double taxation, some investors hold stocks in growth companies that reinvest their accumulated earnings instead of paying large cash dividends.
Companies will sometimes reinvest their accumulated earnings back into the business instead of paying out dividends. This allows the company to accumulate capital and grow faster than it otherwise might. As a firm's earnings grow, people expect its stock price to rise. If this happens, the stockholders can sell their stock and pay capital gains taxes on their profits. The Tax Reduction Act of 1997 set a lower tax rate on capital gains than on dividends. Taxes on capital gains are paid only upon the realization of the gain, meaning when it is sold. Investors can reduce their tax bills by delaying the sale of securities to postpone realization of capital gains.
Even though stockholders hold ownership of the corporation, they do not exercise control over the firm's day-to-day activities of doing business. They do, however, exercise control over the firm's operations indirectly by electing the board of directors. It is the task of the board of directors to monitor the management's activities on behalf of the shareholders. As a practical matter, most shareholders cannot actually vote in person, but instead by proxy where they vote by absentee ballot or endorse a representative.
Like common stock, preferred stock represents ownership in a corporation. As the name implies, it receives preferential treatment over the common stock with respect to dividend payments and their claim to the firm's assets in the event of a bankruptcy. Preferred stockholders are entitled to the issue price of their stock plus the dividends they are owed. This is, of course, after the bondholders have been paid.
A preferred stock's dividend is a payment made by the firm at regular intervals, similar to the interest payments on a bond. Most preferred stock is nonparticipating and cumulative. Preferred stock is nonparticipating in the sense that the preferred dividend remains constant regardless of any increase in the firm's earnings.
Firms can decide, however, not to pay the dividends on preferred stock right away. They will be paid in a later period, and are called dividends in arrears. The cumulative feature of preferred stock means that the company always owes these dividends to the preferred stockholders, and they accumulate over time. The firm must pay preferred dividends in arrears before a dividend on its common stock can be paid.
Some preferred stock is issued with adjustable dividends. Adjustable-rate preferred stock became popular in the early 1980s when interest rates were rapidly changing. The dividends of adjustable-rate preferred stocks adjust periodically to changing market interest rates.
Preferred stockholders do not have voting rights. Exceptions to this rule can occur when the corporation is in arrears on its preferred dividend payments, but this is rare.
Convertible preferred stock can be converted to common stock at a predetermined ratio (such as two shares of common stock for each share of preferred stock). If the common stock rises in price, the holder can choose to convert the preferred shares into common shares. After conversion, preferred dividend payments are no longer received.
Convertible bonds are bonds that can be exchanged for shares of common stock. Before conversion it is corporate debt, thus the bond interest and principal payments are contractual obligations of the corporation. Most convertible bonds are subordinated debentures, meaning that they get paid after other bonds are paid, so investors who own convertible bonds have lower ranking claim against corporate profits than most other debt holders.
New issues of securities are called primary offerings. Stock purchases through primary offerings are called primary market transactions. The company uses the funds raised by the sale of securities in primary offerings to expand production, enter new markets, further research, or enhance other aspects of the firm's operations. After this, whenever the securities are bought or sold it is in the secondary market.
If the company has never before offered a particular type of security to the public it is called an unseasoned offering or initial public offering (IPO). If they issue additional securities that are similar to those trading in the secondary market, it is known as a seasoned offering. For example, Wal-Mart "went public" in 1978 when it made its first IPO of common stock that immediately started trading on the New York Stock Exchange under the ticker symbol "WMT." This was an unseasoned offering at the time. When WMT issued more shares of the same common stock it was called a seasoned offering because it was just more of the same stock being released into the market.
A ticker symbol, also simply called a symbol, is a system of letters used to uniquely identify a stock or mutual fund. Symbols with up to three letters are used for stocks which are listed and traded on an exchange. Symbols with four letters are used for most Nasdaq stocks. Symbols with five letters are used for Nasdaq stocks with multiple issues of common stock. Symbols with five letters ending in X are used for mutual funds.
Companies raise money quickly when the stock prices rise because they can sell seasoned offerings to the public at a price higher than the unseasoned offering. They don't have to pay interest to bondholders or loan payments to banks when they raise money this way. Alternatively, as the company's stock drops, it becomes more expensive for the company to capitalize with equity and they have to use more debt, either bonds or bank financing. New issues of equity securities may be sold directly to investors by the issuing corporation, but are usually distributed by an investment banker in an underwritten offering, a private placement, a rights offering, or a shelf registration.
The most common distribution method is an underwritten offering in which the investment banker purchases the securities from the firm at a guaranteed amount and then resells the equity securities to public investors for a greater amount. The difference is called the underwriter's spread, which compensates the investment banker for the expenses and risks involved in the offering.
Also, some equity securities are distributed through private placements in which the investment banker acts only as the company's agent and receives a commission for placing equity securities with investors.
A company will occasionally place equity securities with its existing shareholders. In a rights offering, a company's existing stockholders are given the rights to purchase additional shares at a slightly below-market price in proportion to their current ownership in the company.
An important innovation in the sale of securities is shelf registration. Shelf registration permits a corporation to register a large quantity of securities and sell them over time, rather than all at once. The issuer is able to save time and money through a single registration. In addition, these securities can be brought to market with little notice, thereby providing the issuer with maximum flexibility in timing an issue to take advantage of favorable market conditions.
Any trade of a security after its primary offering is called a secondary market transaction. When an investor buys 100 shares of IBM on the New York Stock Exchange, the proceeds of the sale do not go to IBM. They go to the investor who sold the shares.
From an investor's perspective, the function of a secondary market is to provide liquidity of their assets at fair prices. An asset is an item of value owned by an individual or corporation. Liquidity is the speed at which an asset such as stock, bonds, or real estate, can be converted into cash.
Liquidity is achieved if investors can trade large amounts of securities without affecting prices. Prices are said to be fair if they reflect the underlying value of the security correctly.
There are three liquidity-related characteristics of a secondary market that investors find desirable: depth, breadth, and resiliency. First, a secondary market is said to have depth if there are orders both above and below the price at which it is currently trading. When a security trades in a deep market, temporary imbalances of purchase or sale orders that would otherwise create substantial price changes are offset with corresponding orders. Second, a secondary market is said to have breadth if its orders give its market depth in a significant volume. The broader the market for a stock, the greater the potential for stabilization of temporary price changes that may arise from order imbalances. Third, a market is resilient if orders promptly respond to price changes.
There are four types of secondary markets: direct search, brokered, dealer, and auction. Each type differs according to the amount of price information investors have access to.
The secondary market that offers you the least amount of price information is that in which the buyers and sellers have to search each other out directly. For this reason, this is called a direct search secondary market. Because the full cost of locating and bargaining with a willing and capable trading partner is paid by an individual investor, there is only a small incentive to conduct a thorough search among all possible partners in the market for the best possible price. By the time a trade is agreed upon by the two investors, at least one of the participants could have gotten a better price if they were in contact with some other participant they never found. Stocks that trade in direct search markets are the ones people buy and sell so infrequently that a third party, such as a broker or a dealer, has no incentive to provide any kind of service to facilitate this trading. The common stock of smaller companies, especially small banks, trades in direct search markets. Buyers and sellers of those issues must rely on word-of-mouth communication to attract compatible trading partners. The relatively small number of trades makes it difficult to find an economical way of broadcasting quotations or transaction prices. Trades can occur at the same time at quite different prices, and these transactions are usually far from the best possible price.
When the trading of a specific stock becomes sufficiently heavy, brokers begin to offer specialized search services to market participants. For a fee, called a brokerage commission, brokers help find compatible trading partners and negotiate acceptable transaction prices for their clients.
Brokers are most likely to be involved when a lot of investors are in the market because it is more profitable for them. If a broker can fill two customer's orders at a cost less than twice the cost of the direct search that would otherwise be conducted by each of those customers, then brokers will offer their services. This is important because they can profitably acquire the business of both investors by charging a commission somewhat less than the cost of a direct search.
Since brokers are frequently in contact with many market participants on a continuing basis, they are likely to know what a "fair" price is for a transaction. Stock brokers arrange transactions closer to the best available price than is possible in a direct search market. Their extensive contacts provide them with a pool of price information that individual investors could not economically duplicate because of cost. By charging a commission less than the cost of direct search, they give investors an incentive to use the information the broker has.
Even though a brokered market is better than a direct search market, a brokered market cannot guarantee that orders will be executed promptly. Not knowing about the speed of execution creates price risk. While a broker is searching for a trading partner for a client, prices may change and the client may suffer a loss.
As the trading of a stock becomes even more active, some market participants may begin to maintain bid and offer quotations of their own. These traders become dealers. They buy and sell their own inventory at their own quoted prices. Dealer markets eliminate the need for time consuming searches for trading partners, because investors know they can buy or sell immediately at the quotes given by a dealer.
Dealers often sell their stocks at a price greater than the bid price they pay. The difference between the two, called the bid-ask spread, compensates them for providing the liquidity of an immediately available market to occasional participants. This also pays for the risk that dealers incur when they position a security in their inventory. The bid price is the highest price that someone is willing to pay to buy shares of stock. This also means that this is the highest price you can expect to get for your shares of stock when selling them. It is always lower than the ask price. The ask price is the lowest price you can pay for a stock. This is because it is the lowest price any seller is offering their shares for.
Although dealer markets provide investors with the opportunity for an immediate execution of their orders, and although dealer markets can usually be searched more rapidly and cheaply than a direct search or brokered markets, they do have several disadvantages. No one can guarantee that the quotation of a particular dealer could be improved upon by contacting another dealer. This being the case, investors operating in dealer markets have to bear some cost of searching for the best price.
Auction markets provide centralized procedures for the exposure of purchase and sale orders to all market participants simultaneously. In other words, an auction market is a place where anyone who wants to buy and sell can go to. This is important because auction markets virtually eliminate the expense of locating compatible partners and bargaining for a favorable price. The communication of price information in an auction market may be oral if all participants are physically located in the same place, or the information can be transmitted electronically.
Securities not sold on an organized exchange like the NYSE are traded over-the-counter (OTC). A stock may not be listed on an organized exchange for several reasons, including lack of widespread investor interest, small issue size, or insufficient order flow. The OTC stock market is a dealer market. Since different OTC issues are not usually close substitutes for each other, a dealer with limited capital can make a profit with a relatively narrow range of stock inventory. As a result, there is a large number of small OTC dealers. They often concentrate their trading in particular industry groups or geographical areas. It is estimated that about 30,000 various types of equity securities are traded in the OTC market. However, only about 15,000 of these securities are actively traded.
When customers place a buy or sell order for a stock in the OTC market, a broker will contact other dealers who have that particular stock for sale and search out the best price. When satisfied, he or she will complete the buy or sell transaction with that dealer and charge his or her customer the same price plus a commission for the brokerage services.
A major development of the OTC market occurred in 1971 when the National Association of Securities Dealers (NASD) introduced an automatic computer-based quotation system, called NASDAQ. The system offers continuous bid-and-ask prices for the most actively traded OTC stocks. NASDAQ's development accelerated the disclosure of price information, and it also fundamentally altered the structure of the OTC market.
There are three levels of access to the NASDAQ system. Level 3 terminals are available only to dealers and allow them to enter bid and ask quotations for specific stocks into the system. These quotations, together with information identifying the stock and the dealer, appear within seconds on the terminals of other dealers and brokers. For this reason, the NASDAQ always has current prices. Level 2 terminals display all the dealer bid and ask quotations for a given stock, but do not allow that quotation to be changed on the terminal. These terminals are available to brokers and institutions. Level 1 terminals provide only the best bid and ask price (called the inside quote) for a stock. These terminals are used by stockbrokers when quoting prices to their customers.
This greatly increased the efficiency of a broker's search for the best bid-and-ask prices, reducing the amount of trading away from the best available prices.
The New York Stock Exchange (NYSE), the preeminent, biggest and most organized stock exchange in the United States, is an example of an auction market. Other regional stock exchanges in the United States include the American Stock Exchange (AMEX) in New York, the Pacific Stock Exchange in both San Francisco and Los Angeles, the Chicago Stock Exchange, the Philadelphia Stock Exchange, the Boston Stock Exchange, and the Cincinnati Stock Exchange. The NASDAQ and the NYSE account for the vast majority of stock trading. Regional exchanges account for little of the total stock trading volume in the United States.
All transactions in a stock listed on the NYSE and completed within that exchange occur at a unique place on the floor of the exchange, called a post. There are three major sources of active bids and offerings in an issue available at a post: (1) floor brokers executing customer stock orders, (2) limit price orders for stock left with the specialist for execution, and (3) the specialist in the stock buying and selling for his or her own account. Since trading is physically localized, the best available bid-and-offer quotes are very available. Competition and ease of communication among market participants at a post ensure the absence of bids above the lowest offer price or offerings below the highest bid for the stock.
Orders from the public are transmitted by internet, telephone, or telex from brokerage houses to brokers on the floor of the NYSE, who bring the orders to the appropriate posts for execution. Most of these orders are either market orders or limit orders.
A market order is an order to buy or sell at the best possible price available at the time the order reaches the post. The broker bringing a market order to a post might execute the order immediately upon his arrival, or he might hold back all or part of the order for a short time to see if he or she can get a better price than is currently available. He or she may also decide to quote a price on the transaction to reduce the amount of time he or she will have to wait until completing the trade.
A limit order is an order to buy or sell at a designated price or at any better price. Investors place limit orders when they want to buy or sell at a price well above or well below the bid-ask spread. A floor broker handling a limit order to buy at or below a stated price, or to sell at or above a stated price, will usually stand by the post with his order if the limit price on the order is near the current market bid-and-ask prices.
When a limit order is at a price that is not very close to the current market prices (the bid-and-ask), the broker handling the order knows it is unlikely the order will be executed anytime soon. For example, a bid or purchase order at $50 on a stock currently trading at $55 may not be satisfied for days, or even may never be satisfied. As an alternative to maintaining a physical presence at the post, the broker can enter the limit order on the order book maintained by the specialist. No trades can take place at a particular price unless all bids are above and all offerings are below it. In other words, the market has to move up through all of the sell limit orders in the book to hit your sell limit orders. Alternatively, the market has to move down through all other limit orders in the book between your limit order's price before it can be executed. Entering a limit order on a specialist's book is a great alternative to floor brokers who would otherwise have to maintain a physical presence at a post to keep a limit order active.
Specialists provide the third source of bids and offers in listed securities. On the NYSE, Specialists are members of the exchange who are both dealers and order clerks. Specialists have to maintain the price quotations at all times for the issue in which they specialize. Specialists also act as dealers, trading for their own account and at their own risk. NYSE specialists act as order clerks as well, maintaining the book of limit orders for the floor brokers.
Heavy trading volume ensures that there are always active bids and offerings available from either floor brokers or the limit order book. In these cases, the dealer function of the specialist is to be a source of liquidity so that your orders get filled quickly if trading is more sporadic or infrequent. In these cases the obligation of the specialist to provide the liquidity service of immediate execution is vital. Indeed, if the prices of the purchase and sales orders on the specialist's book have a wide spread (which is common for infrequently traded stocks), the specialist may be the sole source of a market for immediate transaction.
Better communications and computer technology have reduced transaction costs, making it easier for other financial intermediaries to compete with securities firms. This has led to the emergence of a so-called "national market" system, online discount trading, 24-hour trading of equity securities, and the globalization of equity markets.
The Securities Act Amendment of 1975 mandated that the Securities and Exchange Commission (SEC), the primary regulator of U.S. financial markets, move toward creating a national market system. In its ideal form, a national market system would have a comprehensive method of recording and reporting transactions regardless of where they take place in the country. It would also be a system that allowed investors to get price information from any exchange instantaneously, and thus a way to buy or sell stock at the best price regardless of location. Progress has been made toward electronically linking the national exchanges, regional exchanges, and over-the-counter markets, but we are still many years away from a truly nationwide system.
There is competitive pressure to link international stock markets as well. Many U.S. firms are issuing stocks on overseas exchanges to take advantage of differences in tax laws, to increase their visibility and reputation, and to avoid flooding local stock markets. In 1986, the London Stock Exchange created a computer network similar to the NASDAQ system and permitted U.S. and Japanese investment firms to enter trades on the system. This development was important because it created a virtual 24-hour global trading environment, given time differences between New York, London, and Tokyo.
Stock exchanges in the United States are panicked about losing business to overseas stock markets. As a step toward increasing the global competitiveness of the U.S. financial markets, the SEC permitted after-hours trading on the NYSE. Before this, trading only took place between 9:30 AM and 4:00 PM Eastern time. The NYSE now has several after-hours trading sessions during which shares trade electronically at the day's closing price. The biggest beneficiaries of the NYSE's move toward globalization will be U.S. companies that expect to broaden the market for their securities.
Unfamiliar market practices, confusing tax legislation and insufficient shareholder communication often discourage investors from participating in foreign stock markets. Many foreign companies overcome these road blocks by means of American Depository Receipts (ADR). An ADR is a dollar denominated claim issued by a bank representing ownership of shares of a foreign company's stock held on deposit by U.S. investors. With over 1,600 ADRs from 63 countries trading in the United States, they are very popular with U.S. investors because they allow investors to diversify internationally.
A sponsored ADR is one for which the issuing foreign company absorbs the legal and financial costs of creating and trading the security. An un-sponsored ADR is one in which the issuing firm is not involved with the issue at all and may even oppose it. Un-sponsored ADRs typically result from U.S. investor demand for shares of particular foreign companies.
Trading in securities in the United States is regulated by several laws. The two major laws are the Securities Act of 1933 and the Securities Exchange Act of 1934. The 1933 act requires full disclosure of relevant information relating to the issue of new stock in the primary market. This act requires full registration of an IPO and the issuance of a prospectus which details the recent financial history of the company, and is concerned only that the relevant facts are disclosed to investors. The 1934 act established the Securities and Exchange Commission (SEC) to administer the provisions of the 1933 act. It also extended the disclosure of the 1933 act by requiring firms with stocks traded on secondary exchanges to periodically release current financial information.
Under the 1934 act, the SEC has the authority to register and regulate securities exchanges, over-the-counter (OTC) trading, brokers, and dealers. The SEC is responsible for broad oversight of secondary markets. In addition, security trading is also subject to state laws.
Stock valuation is a tricky matter and a subject you must understand as a stock investor. To understand stock value you need to understand market capitalization, book value, fundamental analysis, and technical analysis.
Market capitalization is simply the total value of all outstanding shares of a company. To calculate the market capitalization, multiply the total number of shares outstanding of each class of common and preferred stock by its corresponding share price. Assume, for instance, that a company has 1,000,000 shares of common stock outstanding trading at $15 per share and 2,000,000 shares of preferred stock trading at $10 per share. The market capitalization of the company is as follows:
Market Capitalization:
(1,000,000 Shares)($15/Share) + (2,000,000 Shares)($10/Share) =
$15,000,000 + $20,000,000 =
$35,000,000
Book value is the value of the company as shown on the firm's balance sheet. This is the value of everything the company owns less everything it owes. This number may not necessarily reflect the true value of the firm, but it is generally a fair indication.
Fundamental analysis focuses on the company's financial information, including the balance sheet, the income statement, and cash flow statement. The primary concept here is that increased earnings enhance the value of the firm. Since the shareholders are the owners of the firm, the idea is that increased corporate profits increase the share price of the company's stock.
Technical analysis attempts to predict the future direction of stock price movements based on three types of information: historical price, volume behavior, and market sentiment.
Stock market indices provide a useful tool to summarize the vast array of information generated by the continuous buying and selling of stocks. However, the use of market indices presents two problems. First, many different indices compete for attention. Second, indices differ in their composition and can give contradictory information regarding price movements of the stock market.
When constructing a stock market index, the base value and the starting date have to be selected. Only the relative changes in the index values are useful. For example, knowing only that a particular stock market index finished the year at a level of 354.7 is of no value. But if you also know that the same index finished the previous year at a level of 331.5, then you can calculate that the stock market, as measured by this particular index, rose approximately 7 percent over the past year.
The next decision is which stocks should be included in the index. There are three methods for deciding stock market composition: (1) the index can represent a stock exchange and include all the stocks traded on the exchange, (2) the organization producing the index can subjectively select the stocks to be included, or (3) the stocks to be included can be selected based on some objective measure such as market value. Often an index represents the performance of various industry segments such as industrial, transportation, or utilities.
Once the stocks to be included in an index are selected, the stocks must be combined in certain proportions to construct the index. Each stock, therefore, must be assigned some relative weight, usually by share price or market value of the company.
A price-weighted index is computed by summing the prices of the individual stocks in the index. Then the sum of the prices is divided by a divisor to yield the chosen base index value. Thereafter, as the stock prices change, the divisor remains constant.
For example, if the price per share of three stocks in a price-weighted index were $20, $10, and $50 respectively, then the prices would sum to $80. If the base index value is to be 100, then the initial divisor would be 0.8 because 100 = 80/0.8. On the next trading day, say prices per share of the stocks change to $25, $10, and $40. Now the new sum of share prices would be $75 and the price weighted index value would be 75/0.8 = 93.75 or 6.25 percent lower.
A market value-weighted index is computed by calculating the total market value of the firms in the index and the total market value of those firms on the previous trading day. The percentage change in the total market value from one day to the next represents the change in the index.
For example, if the three stocks described in the example above had outstanding shares of 100 million, 200 million, and 10 million, then the total market value for the three stocks on the first day would be $4.5 billion. The total market value on the second day would be $4.9 billion, for an increase of 8.8 percent. If the market value-weighted index began with a a base index value of 10 on the first day, then its value on the second day would be 10.88, or 8.8 percent higher.
The most widely cited stock market index is the Dow Jones Industrial Average (DJIA) which was first published in 1896. The DJIA is a price-weighted index that originally consisted of 20 stocks with a divisor of 20; this means that the value of the index was simply the average price of the original 20 stocks. In 1928, the DJIA grew to encompass 30 of the largest U.S. industrial stocks and includes today such companies as Verizon, Dupont, and Merck.
The New York Stock Exchange Index, published since 1966, includes all of the common and preferred stocks listed on the NYSE. In addition to the composite index, the NYSE stocks are divided into four sub-indices that track the performance of industrial, utility, finance, and transportation stocks. All the NYSE indices are market-value weighted.
The Standard and Poor's (S&P) 500 Index is a value-weighted index that consists of 500 of the largest U.S. stocks from various industries. The stocks included in the S&P 500 account for over 80 percent of all the stocks listed on the NYSE, although a few NASDAQ issues are also included. The index is computed on a continuous basis during the trading day. It is divided into two sub-indices that follow the performance of industrial and utilities companies.
The S&P 400 MidCap Index is market-value weighted and consists of 400 stocks with market values less than those of the stocks in the S&P 500. The S&P 400 MidCap index is useful for following the performance of medium-sized companies.
The S&P 600 SmallCap Index tracks 600 companies with market values less than those of the companies in its S&P 600 MidCap index. The S&P 1500 index includes all of the companies in the S&P 500, the MidCap 400, and the SmallCap 600.
The NASDAQ Composite has been compiled since 1971. It consists of three categories of companies: industrial, banks, and insurance. All of the stocks traded through the NASDAQ are included. In 1984, the NASDAQ introduced two new indices, the NASDAQ/ NMS Composite index and the NASDAQ/ NMS Industrial Index. Both are weighted by market capitalization.
If you don't want to actively buy and sell individual securities, you can invest in stocks, bonds, or other financial assets through a mutual fund. Mutual funds are simply a way of pooling together money of a large group of investors. The buy and sell decisions for the pool are made by fund managers who are paid for the service they provide.
Mutual funds provide indirect access to financial markets for individual investors; these funds are a form of financial intermediary. Mutual funds have a lot of power. They are now the largest type of financial intermediary in the United States, followed by commercial banks and life insurance companies.
As of the end of 2001, about 93 million Americans in 55 million households owned mutual funds, up from 5 million households in 1980. Investors contributed $505 billion to mutual funds in 2001, and total mutual fund assets totaled $7 trillion.
There are two type of mutual funds, open-end and closed-end. Whenever you invest in a mutual fund, you do so by buying shares in the fund. However, how your shares are bought and sold depends on which type of fund you are considering.
With an open-end fund, the fund itself will sell new shares to anyone wishing to buy and will buy back shares from anyone who wants to sell. When an investor wants to buy open-end fund shares the fund simply issues the shares and then the fund manager invests the money received from the investor. When someone wants to sell open-end fund shares, the fund sells some of its assets and uses the cash to redeem the shares. As a result, with an open-end fund, the number of shares outstanding fluctuates over time.
In a closed-end fund, the number of shares is fixed and never changes. If you want to buy shares, you must buy them from another investor. Similarly, if you wish to sell shares that you own, you must sell them to another investor.
A mutual fund's net asset value (NAV) is calculated by taking the total value of the assets held by the fund less any liabilities and then dividing by the number of outstanding shares. For example, suppose a mutual fund has $105 million in assets and $5 million in liabilities based on current market values and a total of 5 million shares outstanding. Based on the value of net assets held by the fund, $100 million, each share has a value of $20 ($100 million / 5 million shares).
Shares in an open-end fund are always worth their net asset value. In contrast, because the shares of closed-end funds are bought and sold in the stock market, the share price is dictated by the market and may or may not be equal to the NAV.
A mutual fund is simply a corporation. Like a corporation, a mutual fund is owned by its shareholders. The shareholders elect a board of directors, and they are responsible for hiring managers to oversee the fund's operations. Every individual fund is a separate company owned by its shareholders.
Most mutual funds are created by investment advisory firms, which are businesses that specialize in managing mutual funds. Such firms have additional operations as discount brokerages or offer other financial services.
An investment advisory firm can create multiple funds. Over time, this process leads to a family of funds all managed by the same advisory firm. Each fund in the family will have its own fund manager, but the advisory firm will generally handle the record keeping, marketing, and much of the research that underlies the fund's investment decisions.
As long as an advisory firm meets certain rules set by the Internal Revenue Service, it is treated as a "regulated investment company" for tax purposes. This is important because a regulated investment company does not pay taxes on its investment income. Mutual funds act as a "pass-through entity" in terms of tax law, funneling capital gains and losses to the shareholders in proportion to their investment.
1. Capital appreciation stock funds seek maximum capital appreciation. They generally invest in companies that have, in the opinion of the fund manager, the best prospects for share price appreciation without regard to dividends or company size. Often this means investing in unproven companies or out-of-favor companies.
2. Growth stock funds seek capital appreciation, but tend to invest in large, more established companies. These funds may be somewhat less volatile as a result. Dividends are an important consideration for the mutual fund manager in purchasing a stock.
3. Growth and income funds seek capital appreciation, but at least part of their focus is on dividend-paying companies.
4. Equity income stock funds focus almost exclusively on stocks with relatively high dividend yields, thereby maximizing the current income on the stock portfolio. The dividend yield is the anticipated dividend divided by the present price of a share of stock.
5. Small company stock funds focus on stocks in small companies. "Small" refers to the total market value of the stock. Small stocks have historically performed very well, at least over the long run, hence the demand for funds that specialize in such stocks. With small-company mutual funds, what constitutes small covers a wide range from perhaps $10 million up to $1 billion or so in total market value, and some funds specialize in smaller companies than others. Since most small companies don't pay dividends, these funds necessarily emphasize capital appreciation.
6. Mid-cap stock funds specialize in stocks that are too small to be in the S&P 500 index but too large to be considered small stocks. Hence, the stocks these mutual funds specialize in are considered to be middle sized stocks or medium sized by market capitalization.
7. Global stock funds have substantial international holdings but also maintain significant investments in U.S. stocks.
8. International stock funds are similar to global funds, but focus most on foreign securities.
9. Index stock funds simply hold the stocks that make up a particular index in the same proportions as the index. The most important index funds are the S&P 500 indexed stock mutual funds which are intended to track the performance of the S&P 500. By their nature, index funds are passively managed and trade only as a necessary to match the index. Such funds are appealing in part because they are generally characterized as low turnover and low operating expenses.
10. Social conscience stock funds are a relatively new creation. They invest only in companies whose products, policies, or politics are viewed as socially desirable. The specific social objectives range from environmental issues to personnel policies. Of course, general agreement on what is socially desirable or responsible is hard to find.
11. Tax-managed stock funds are managed with high regard for the tax liabilities of mutual fund shareholders. Tax-managed stock mutual funds try to hold down turnover to minimize realized capital gains, and they try to match realized gains with realized losses. Fund shareholders have largely escaped taxes as a result.
Exchange traded funds (ETF) are a recent financial innovation. When you purchase an ETF, you are buying the same combination of stocks on a given index. For example, the best known ETF is Standard and Poor's Depository Receipt (SPDR), pronounced "spider," which is based on the S&P 500 index.
What makes an ETF different from an index fund is that it can be traded in the open markets, leaving the possibility for arbitrage. Arbitrage is an activity that involves simultaneously buying and selling a security to take advantage of a price difference in two markets. In plain language, if a company's stock is selling for $12 on the NYSE and $9 on the AMEX, then arbitrageurs will buy the stock on the AMEX and sell the same stock on the NYSE for as much as they can and as fast as they can. The increased buying on the AMEX will cause the price to rise on the exchange while on the other hand the increased selling on the NYSE will cause the price on that exchange to fall until the price is the same on each exchange. In finance we say that arbitrage keeps prices in line by forcing price convergence or one-price for the same asset such as a stock. This is also known as the law of one price.
Hedge funds are a special type of investment company. They are like mutual funds in that a fund manager invests a pool of money for investors and takes his fee off the top. However, unlike mutual funds, hedge funds are not required to register with the SEC. They are only lightly regulated and are generally free to pursue almost any investment style they wish.
Hedge funds are also not required to maintain any degree of diversification or liquidity. They don't have to redeem shares on demand, and they have little in the way of disclosure requirements. The reason that hedge funds avoid many of the restrictions placed on mutual funds is that they only accept "financially sophisticated" investors. They do not offer their securities for sale to the public. Some types of hedge funds are limited to no more than 100 investors.
Hedge funds typically have a special fee structure, where, in addition to a general management fee of one to two percent of fund assets, the manager is paid a special performance fee. A modest fee structure might be one that charges an annual management fee of one percent of the fund's assets plus twenty percent of any profits realized; however, more elaborate fee structures are common.
Whether large or small, each fund develops its own investment style or niche. For example, a hedge fund may focus on a particular sector or global region. Alternatively, a hedge fund may pursue a particular investment strategy, like the market neutral strategy, in which the fund maintains a portfolio approximately equally split between long and short positions. By being long in some securities and short in others, the portfolio is hedged against market risk and said to be market neutral.
Short is a term meaning short selling. This is the sale of a security made by an investor who does not own the security. The short sale is made in expectation of a decline in the price of a security, which would allow the investor to then purchase the shares at a lower price in order to deliver the securities earlier sold short.
Options are securities that make it possible to invest in stocks without actually owning the shares. Options on stock are bought to speculate on price movement. Stock options are themselves securities and can be traded in financial markets. An option to buy a stock is known as a call option or just a call. Options to sell securities are known as put options or just puts.
Options are the most important example of a class of financial assets known as derivative securities. A derivative is so named because it derives its value from the price of another underlying security, in this case the optioned stock.
Investors are interested in stock options because they provide speculative leverage, a term applied to any technique that amplifies the return on an investment. An option's leverage comes from the fact that the return on the investment can be many times larger than the return on the underlying stock.
There are two parties to a contract, a buyer and a seller. The first person to sell an option contract is the person who creates it by agreeing to sell the stock at the strike price. He or she is said to write an option and is called the option writer.
Once the option is written, the option contract becomes a security and the writer sells it to the first option buyer, who may sell the contract to someone else later on. No matter how many times the option is sold, the writer remains bound by the contract to sell or buy the underlying stock to the current option owner at the specified price.
Options are written either covered or naked. With a covered option, the writer owns the underlying stock at the time the option is written. Someone who writes a naked option doesn't own the underlying stock at the time he or she writes the option and therefore faces more risk.
If a stock's current price is below the strike price in the case of a call, or above the strike price in the case of a put, we say that the option is "out of the money" because the option contract buyer could not make any money exercising the contract. If the stock's price is above the strike price in the case of a call, or below the strike price in the case of a put, we say that the option is "in the money" because the option contract buyer could make money exercising the contract.
In general, the option's intrinsic value is the difference between the underlying stock's price and the option's strike price. Investors are willing to pay premiums over intrinsic value for stock options because of the chance that they will earn even more profit. Option premium is the difference between the intrinsic value of the option and the option's price. The exact amount of a particular option's premium above intrinsic value depends on the stock's volatility, the time until expiration, and the attitude of the market about the underlying company.
It's important to keep in mind that options are exercisable over only a limited period at the end of which they expire and become worthless. That makes option investing very risky. For example, if an option is purchased "out of the money" and the option never gets "in the money," the option expires, worthless. The buyer loses the entire price paid for it.
If an option is purchased at a price that includes a positive intrinsic value and the underlying stock goes down in value, the option buyer's loss at expiration is the time premium paid plus the decrease in intrinsic value. As its expiration date approaches, any option's time premium shrinks to virtually nothing. Notice that anyone owning an option with a positive intrinsic value just before expiration must act quickly to avoid losing value.
It's important to note that the options discussed up until now are strictly bought and sold in the secondary market. That is, they're traded between investors, and the companies don't get involved. Specifically, companies don't get any money when the options are written or exercised.
Warrants are similar to call options but are issued by the underlying companies themselves. When a warrant is exercised, the company issues new stock in return for the specified price. Warrants are therefore primary market instruments. Warrants are like call options in that they give their owners the right to buy stock at a designated price over a specified time period. They differ from stock options in that the time period is much longer, typically several years.
Warrants are usually issued in conjunction with other financing instruments as "sweeteners" to make the primary security more attractive. For example, suppose a company wants to borrow, but isn't in good financial condition, so lenders have rejected its bonds. They may be induced to buy the company's bonds if the firm attaches one or more warrants to each bond giving the holder the right to buy a share at $50 within the next five years. The warrants provide incentives to buy the bonds if people think the stock is likely to go over $50 before five years have passed. If bond holders do exercise the warrants then the company will receive additional cash as they issue new shares that are sold to fulfill the warrants.
Warrants can generally be detached and sold independently at a market value of their own. This effectively reduces the price of the bonds and increases their yield to the investor. Alternatively, bondholders can keep the warrants and exercise them for a quick gain if the stock's price rises above $50. Notice that if the warrants are exercised, the company receives an equity infusion based on a price of $50 rather than the higher market price. The bonds are unaffected by the exercise of the warrants.
For many years, American companies have given certain employees stock options as part of their compensation. Companies like paying with options because they don't cost anything when issued. Since employees who receive options get lower salaries, the practice improves the company's financial statements by lowering payroll costs. Beyond that, supporters maintain that the employees will be more motivated to act in the best interest of the company, since the value of their options are directly tied to market price.
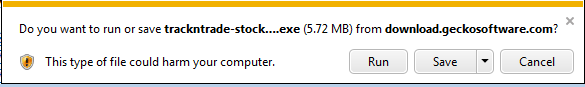
When you first download the program this window will appear.
-Click Save
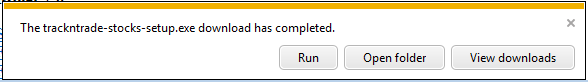
Next you will see the Open File Window.
-Click Run
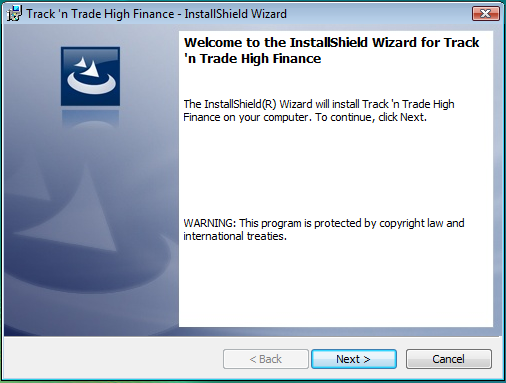
The Track 'n Trade High Finance Installation Wizard window will appear. This will guide you through the installation process.
-Click Next
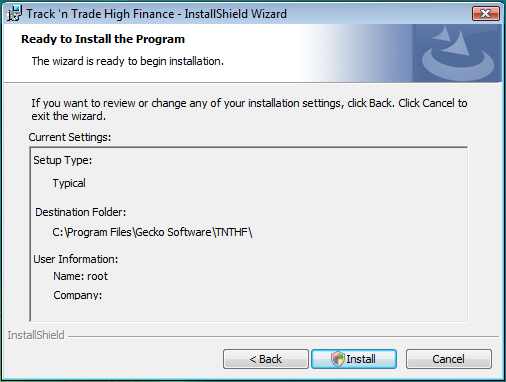 Next you will have to confirm your installation.
-Click Install
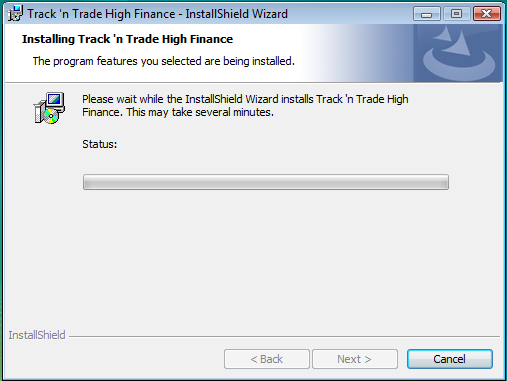
An installing screen will appear. This may take a few minutes.
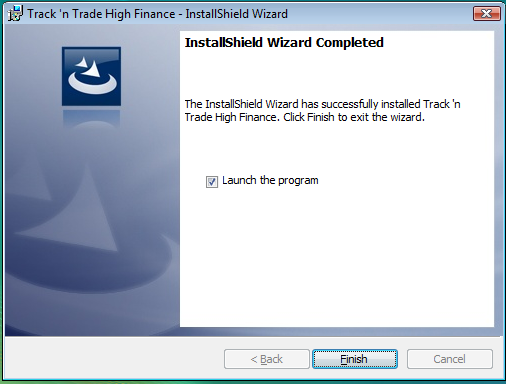
Once installation is complete this window will appear.
-Click Finish
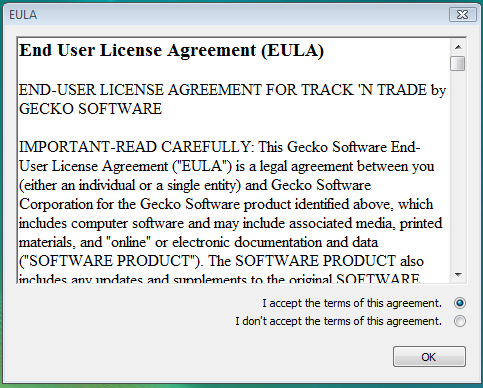
Please read the End User License agreement and if you agree to the terms of use.
-Agree to terms by selecting the button next to I accept
-Click OK
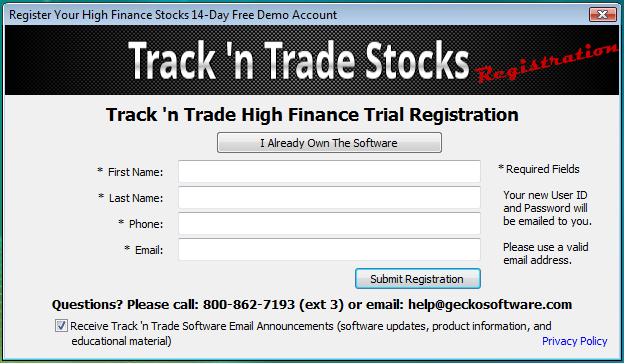
Here you will enter your personal information.
-All fields are required for trial software registration.
-Click Submit Registration
The start up screen will appear next. This is the screen you will see when you start up Track 'n Trade High Finance. To open the software, enter your email address and password into the fields provided and click Connect.
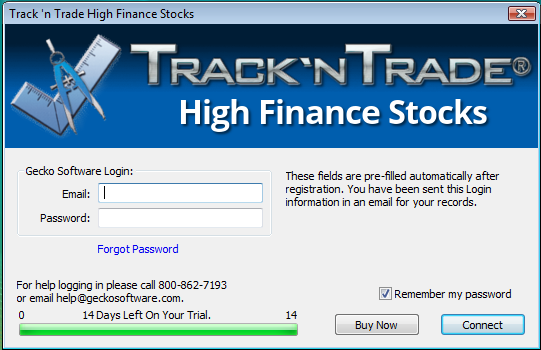
The option to Remember my password is available in Track 'n Trade High Finance. Remember, logging-in gives you access to your financial information through Track 'n Trade High Finance. Be aware that others may use these saved passwords and access this information.
The Account Manager was created to give Gecko Software customers a convenient resource to update their personal information with us, such as your billing, shipping, and payment information.
To access the Account Manager, log-in to Track 'n Trade High Finance, click on the Help Menu, and select Account Manager. The Account Manager will open in your default browser. (You will not need to enter your email address and password if you are already logged-in to the program.)
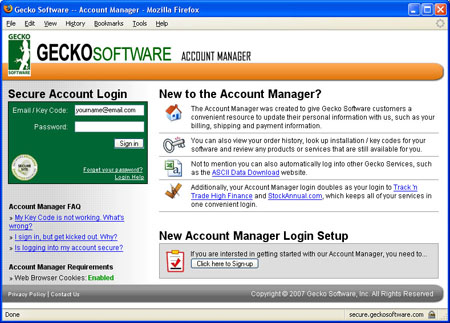
Or, access your Account Manager by visiting www.trackntrade.com [2] or www.geckosoftware.com [3] and click on Account Manager. To log-in to the Account Manager, use the same email and password you use to access Track 'n Trade. There are links below the log-in to help you in case you forget this information. If you do not have a password, click on the "Click Here to Sign-Up" button on the bottom of the screen. It is helpful to read the information given here.
Once you have logged in, a screen will appear with your information on it. The top of the screen is a menu with Home, Update Account, Order History, and Available Products tabs.

From the Home page you can view your Account Details at the top left corner, which include your current address and phone number. You can change this information by clicking Review. You will also see any Account Notices, such as a notice that one of your subscriptions needs to be renewed. Below will be a list of your current subscriptions and a list of the software programs you currently own.
The Update Account page is where you can update your Billing and Contact Information, Shipping Information, Payment Information, and your Password. It is important to keep this information up-to-date.
On the Order History page, there will be a chronological list of all your orders. To view them in detail, click on the Details link on the right side of the screen.
The last page on the menu is Available Products. Here you can view all the Gecko Software products you do not own. Please browse through and make purchases from this window.
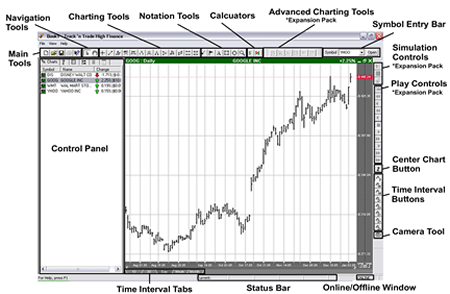
This section will introduce you to the basic functions and features of Track 'n Trade High Finance. First we'll take a look at your workspace. The screenshot below is what you will see when you open Track 'n Trade High Finance. Use this as a reference for the rest of the manual. The following pages will go into further detail of the functions of each Toolbar and Menu you see here.
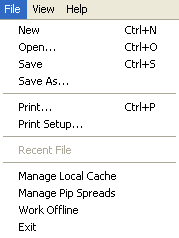 New: Closes the chartbook that is open and creates a new blank chartbook.
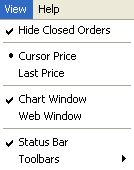 Hide Closed Orders: Hides any orders that have been closed.
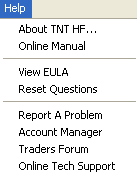 About TNT HF: Shows the version of Track 'n Trade High Finance installed.
Each toolbar can be customized to fit your trading needs. To customize a toolbar, place mouse over the toolbar and right click, then select Customize Toolbar.
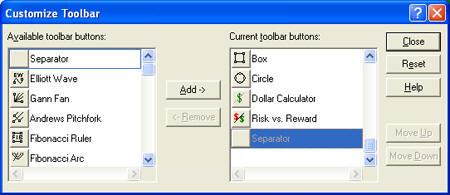
To add buttons, select desired buttons and click Add. To delete unwanted buttons, select and click Remove. To restore default buttons, click Reset. When you have made your changes, select Close to save your changes and return to the program.

New: Closes your current chartbook and opens a new chartbook. Open: Closes your current chartbook and opens a window for you to choose a previously saved chartbook. Save: Saves your open charts as a chartbook. Print: Prints the Chart Window. Help: Click on this button, then click anywhere in the software to learn more about that feature.

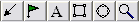
Pointer: Default tool used for selecting tools and features in the software. Magnifier: Used to zoom in on a section of your chart. You can click and drag to select an area to zoom in on or simply click on the center of the chart to zoom in. To zoom out, hold down the Alt key and click on the chart. Hand: Scrolling tool used in chart window. Click and drag a chart to scroll.

Crosshair Tool: Used to draw a line vertically and horizontally on a chart. Line Tool: Used to draw support and resistance lines. Multi-Line Tool: Used to draw an alternating support and resistance line. Arc Tool: Used to illustrate a rounded top or bottom formation. Day Offset Tool: Measures the number of trading days vs. actual days that are between two points. 123 Tool: Used to chart a 123 top or bottom formation. Head & Shoulders Tool: Used to chart a Head & Shoulders top or bottom formation. Dart/Blip Tool: Used to chart a Dart/Blip up or down formation. Wedge Tool: Used to identify any type of wedge or triangle. Trend Fan Tool: Used to identify a Trend Fan. Trend Channel Tool: Used to identify an inclining or declining channel. Horizontal Channel Tool: Used to identify a horizontal channel. N% Ruler: Used to measure a retracement. Default is 50%.
Arrow Tool: Used to draw arrows to help point out areas of interest. Flag Tool: Used to place a flag or graphic. Text Tool: Used to type text. Box Tool: Used to draw a box. Circle: Used to draw a circle.

Dollar Calculator: Used to find the dollar value between two points on the chart. Risk/Reward: Used to find the difference between two points of the risk and reward zone.
The Advanced Technical Tools only appear if you have the Advanced Technical Tools Expansion Pack, which includes the Elliott Wave Tool, the Gann Fan Tool, the Andrews Pitchfork Tool, the Fibonacci Ruler, the Fibonacci Arc Tool, and the Fibonacci Time Zones.
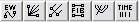
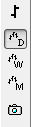 Daily Chart: Each price bar represents a day.
Weekly Chart: Each chart price bar represents a week.
Monthly Chart: Each chart price bar represents a month. The following buttons are integrated with the Time Interval Tabs found on the bottom of a chart at full screen.
Screen Capture: Saves your open chart as an image. Holding down Alt while you click this button will save the chart and control panel to file. Ctrl-click will copy the screenshot to your clipboard (making it ready to paste). Ctrl-Alt-click will copy your chart window plus your control panel to your clipboard.
The Track 'n Trade Control Panel is on the left side of your screen. It includes six tabs: Charts, Account, Reports, Preferences, Data, and Notes.
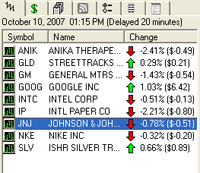 In the Charts Window you will see all the symbols you have opened, the name of the chart, and the change in price of that chart since it opened. To view a specific chart at full screen, double click on the symbol in your Charts Window, or right-click on the symbol and select Open Chart. To delete a chart select it in your Charts Window and hit the delete button on your keyboard, or right-click on the symbol and select Delete Chart. The more charts you open, the slower your computer will run. Note: If you find your computer running slow, you may need to break your charts into two or more chartbooks.
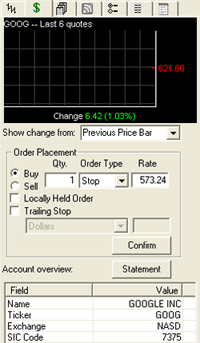 The Chart Quote Window shows a history of quotes. Customize this window by adjusting the Show Change Form to show the change from the Previous Price Bar, Previous Day, or Previous Quote. Order Placement: Displays details of the order you are placing. The time, date, and market you are buying are determined by the date your chart is played to and what market you have open. Once your order is placed, it will not show in your Accounting Simulator until the order is filled. Locally Held Order: This type of order is temporarily held locally at your computer. It is only sent as an actual order when the markets meet the proper conditions of your order. Locally held orders are only available in the Forex version of Track 'n Trade. Trailing Stop: You can only select this option on a Stop Order. It will follow an open position and protect profits by trailing a market rise or decline. You can choose to set your Trailing Stop by Dollar amount, Price Bars Back, or by following the PSAR or Zig Zag indicators. Account Overview: View a detailed overview of your current symbol. Includes the ticker symbol, exchange, open/close data, and much more. The account Statement button will give you access to a detailed tabulation of your account history.
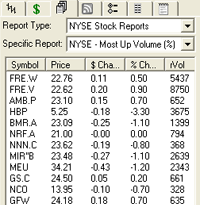 Under Report Type, select the Exchange you would like to get a statistical report from. Then select the statistical report you are interested in under Specific Report. There are 10 reports available that highlight different statistical findings. For example, you can select to see the most actively traded market that is trading higher or lower, or bring up the market that is creating the most news. The information is based on the current day's trading information.
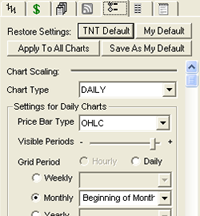 The Preferences Tab will help you customize how your chart, and information on it, looks. It will also show the options for customizing Technical Tools and Indicators. There are many different features found on the Preferences Tab.
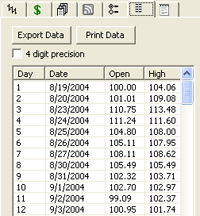 The Data Tab will give you the historical data for each day a specific symbol has traded. It will give you the open price, close price, highest price, and lowest price on the day. It will also show the volume traded. You have the option to print the data for your records, or export the data for use another way. Also, values for indicators are added when the indicator is open.
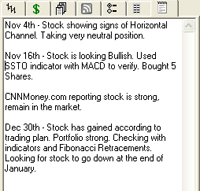 The Notes tab is for your convenience to use as a note pad for your research and trading strategy. A separate note pad is provided for each chart.
Just like a novel is made up of many single pages, a chartbook contains many individual charts. Each chartbook can contain several charts, each individual chart becoming the "pages" of your chartbook. Every time you open Track 'n Trade High Finance, a blank chartbook named Book1 will open. You can either continue with this new chartbook or open a chartbook that has already been saved.
To open a chart, type in the symbol in the Symbol Entry Bar or click on the arrow to the right of the box and select from the dropdown menu. If you do not know the symbol of the market you want to see, select Look Up Keyword for stocks or type in the Forex Market and click Open for Forex.
You can open multiple charts and view them at the same time. The charts will automatically adjust to fit into your Chart Window. Opening too many charts can slow down your computer. If you notice slow downs in your system you may want to break up your charts into two chartbooks or more.
To maximize a chart, double-click on the name of the chart in the Control Panel, or select the maximize button on the top right hand corner of the chart.
To restore the chart to full screen view in your chart window with multiple charts open, click on the restore down button on the top right hand corner of the chart.
To minimize a chart, select the minimize button on the top right hand corner of the chart. This will not delete your chart or any notations or tools you have placed on it. It will only eliminate it from your chart window.
To restore your chart, double-click on the name of the chart in the Control Panel charts list.
To close a chart and remove it from your list of charts, click the X on the top right hand corner of your chart. This will delete any notation or technical tool you have drawn on the chart.
Once you have opened all the charts you would like to save in a Chartbook there are two ways to save it. (1) You can click on the Save button found in the Main Tools, or (2) you can choose File from the Menu Bar and select Save.
To save over or replace a Chartbook that has already been saved, select Save As from the File Menu, and select the chartbook you want to save over.
To print your Chart Window, select the Print button in your Main Tools, or select Print from the File Menu. To print only one chart, maximize it in your Chart Window, then select print.
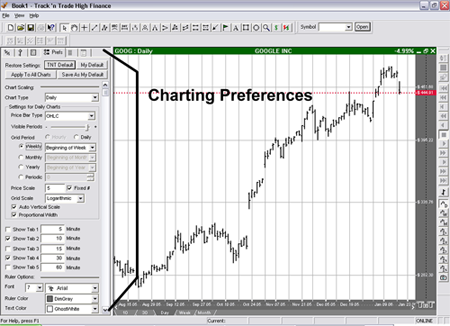
The Chart Preferences Tab is used to control how your chart looks. You can change your price bar style and color, background color, scaling, and even control time intervals. You can also choose to have different styles for each chart, or apply your favorite chart style to all your charts.
The Charting Preferences Tab is located on the Control Panel. To view the Charting Preferences Tab, right-click on the chart and select Chart Preferences, or click on the Preferences Tab in the Control Panel. The Charting Preferences Tab includes Chart Scaling, Ruler Options, Charting Colors, Price Bars, and Onscreen Indicators.
TNT Default will change your settings back to the original software settings. My Default will change current settings to your personalized default settings. Apply To All Charts will apply your selected settings on all open charts. Save As My Default will save your current personal settings.
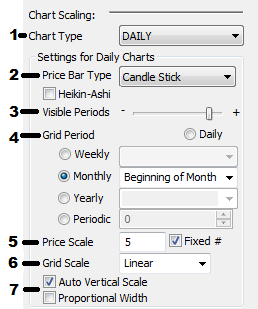 1: Chart Type: Sets the time interval each price bar will represent. You will have different grid options depending on what chart type you choose.
2: Price Bar Type: Choose what information you want your price bar to include.
3: Visible Periods: Scaling tool to make the chart wider or narrower to view different sections of time periods.
4: Grid Period: Sets vertical grid lines at specific intervals. For example, if you have selected a 5, 10, 15, 30, or 60 minute chart type your grid period settings will be limited to hourly, daily, or periodically. However, if you select a daily, weekly, or monthly chart type your grid period settings will be open to selecting any day of the week or month. You can also set your grid line to show daily, or at the beginning of each month, as well as selecting to show them periodically, as shown on the previous page.
5: Price Scale: Sets the amount of horizontal price grid lines you see on your chart, these are equally spaced. If you want to see price grid lines at set intervals, uncheck Fixed, then select what price increments you want your grid.
6: Grid Scale: Linear will keep your grid lines evenly distributed. Logarithmic will continually decrease the amount of space between horizontal grid lines as the price goes up.
7: Auto Vertical Scale keeps the price bars vertically centered on your chart. Proportional Width changes price bar thickness according to scale
Heikin-Ashi:
This price bar analysis method is used by traders to better identify trending markets and patterns. This technique will alter the Open/High/Low/Close of price bars viewed on the chart. The close will be determined by an average of the OHLC values as opposed to the actual market closing price for each bar. The open is determined by averaging the open and close of the previous price bar.
Heikin-Ashi may be activated from the Charting Preferences tab.
Calculation
Close = (Open+High+Low+Close)/4
Open = [Open (previous bar) + Close (previous bar)]/2
High = Max (High,Open,Close)
Low = Min (Low,Open, Close)
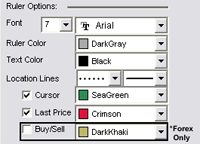 Font: Change the font and size of the text on the ruler.
Ruler/Text Color: Change the background and text color of the ruler.
Location Lines: Change the line style and thickness of your ruler lines.
Cursor, Last Price, Buy/Sell: Select if you would like to see location lines, a last price line, or buy or sell prices on your chart and what color.
The Charting Colors section changes the look of your chart by allowing you to change the background color of the chart and letting you change the color of the horizontal and vertical grid lines.
The price bars, or tics, on your chart can be colored in two different ways. You can select Close to shade them according to their close price, or you can select Alt Days (alternating days) to shade them by odd and even days. In the Highlight section, you have the choice of highlighting the price bar you are over, or highlighting the entire day you are over.
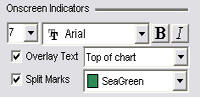 In the Onscreen Indicators section, you have the ability to change the font, size, and style of the text displayed onscreen. Click on the Overlay Text checkbox to display text for an indicator on your chart, then choose whether you would like the text to appear at the top or bottom of the chart. Also, check the Split Marks box if you would like those points displayed on the chart. Split Marks show when a market is split into two markets. Choose your desired color for the split marks as well.
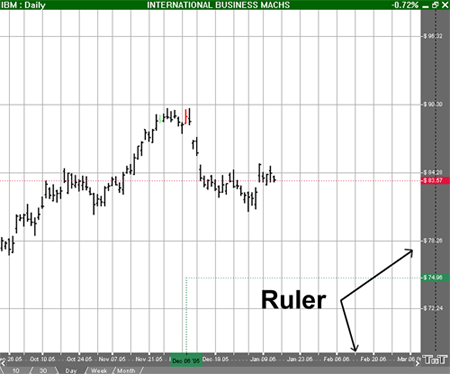
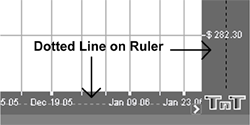 On your ruler you will see a dotted line splitting it in half. If you want to move your chart horizontally or vertically, click and drag the section of the ruler bar closest to the chart. To scale your chart horizontally or vertically, click and drag the section of the ruler bar farthest from the chart.
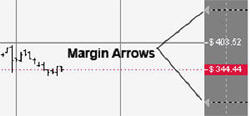 On the Ruler Bar you will notice four Margin Arrows, two on the right ruler, and two on the bottom ruler. These arrows are used to center your chart within these "margins." To move the margin click on the arrow, continue holding down the mouse button, and drag to the new location. Then click on the center chart button to resize the chart.
The right-click menu is a shortcut to customize your chart, add overlay indicators, add indicator windows below your chart, and change other features. Make sure your pointer is selected on your navigation menu, then select the chart and right-click. The following menu will appear.
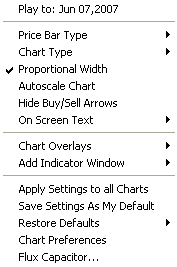 Play to: Date: Your cursor should be in line horizontally with the date you want the chart to play to. Select this option and the chart will either erase price bars to the date or play price bars up to the date you have selected. Choose what Price Bar Type you would like to view.
Chart Type will change the time intervals.
Proportional Width will make your price bar width proportional to the scale of your chart. Autoscale Chart will center your price bars within the height of your chart. Hide Buy/Sell Arrows will show or hide your arrows for the indicator selected. Choose to show your On Screen Text and where you want it to appear.
Select which Chart Overlays you would like to appear on the chart. Or if you would like to Add Indicator Window at the bottom of your chart window.
Apply Settings to all Charts will apply your selected settings on all open charts. Save Settings As My Default will save your current personal settings. Restore Defaults will change your settings back to the original software settings or to your personal saved settings.
Chart Preferences: Select to display the Chart Preferences Tab to the left of your chart.

Toolbars are by default located at the top of the software above your charts but below the menus. These include many important tools and shortcuts to other functions.
Moving Toolbars: The toolbars can be moved around to the user's preference. The 4 dots on the left edge of the toolbar is where the user will click and drag the tool bar to the user's desired location. They can be placed in the top of the software (by default), at the bottom of the software, on the far left and right of the software to make a vertical toolbar, or a floating window anywhere else. When the toolbar is a floating window, move it by clicking and draging the title.

The first tool in the Charting toolbar is the Crosshair tool. This tool is helpful when lining up your technical indicators and recurring price patterns. Click the Crosshair button and position the crosshair on your chart and click your mouse. The crosshair draws a line vertically and horizontally on the chart. To help place the crosshair line on a specific value, the cursor price is displayed on the horizontal line of the crosshair, and the date/time is shown on the vertical line.
To select the drawing, click on the center point of the crosshair and drag to the new location. Release your mouse button to place. The tool is selected when a box appears at the center point.
There are two ways to delete the Crosshair tool. If your crosshair is selected (you’ve clicked on it and the box appears at the center point), you can press the Del (Delete) key on your keyboard. You can also place your mouse cursor over the crosshair and right-click. In the drop-down menu, select “Delete.”
If you only want to delete the horizontal or vertical line of the crosshair, select the crosshair by clicking on it and view the preferences in the control panel. Select or deselect “Show Horizontal (Vertical) Line.” A check will appear in front of the item when it is selected.
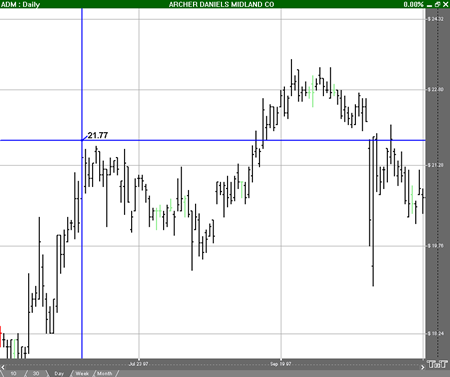
Select the crosshair by clicking on it. The properties will appear in the preferences section of your control panel. Or you can right click on a drawn crosshair tool and select Properties.
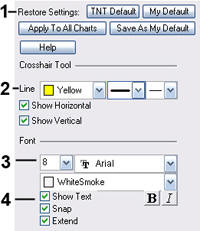
1. Restore Settings: TNT Default will change your settings back to the original software settings. My Default will change current settings to your personalized default settings. Apply To All Charts will apply your selected settings on all open charts. Save As My Default will save your current personal settings.
2. Line: You can choose the color, line style, and line thickness of your crosshair. Deselect Show Horizontal Line or Show Vertical Line to hide your lines.
3. Text: Select the font, size, and color of the text. You can also choose to bold or italicize your text. Select the checkbox next to Show Text to hide or show your text on the chart.
4. Snap: Allows the vertical line to snap to price bars when moved.
Extend: Extends your vertical line into all indicator windows you have open.

To draw a support or resistance line, also referred to as a trend, use the Line tool. Select the Line tool from your Charting toolbar. Click on your chart where you want the line to begin. Hold down the mouse button and move to the position you want your line to end. Release mouse button to place.
Support and Resistance - Technical Analysis
Markets have a tendency to move in troughs and peaks or, more appropriately, "Support and Resistance."
Support
These Troughs are called support, indicating that support is level. This shows that buying interest is strong enough to overcome selling pressure. A decrease in price is reversed and prices rise once again. Typically, a support level is identified by a previous set of lows.
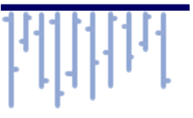
Resistance
Resistance is essentially the opposite of support. Resistance is defined as a horizontal ceiling where the pressure to sell is greater than the pressure to buy. An increase in price is reversed and prices revert downward. Typically, support can be located on a chart by a previous set of highs.
Select the line drawing by clicking on it. The line is selected when boxes appear at the ends of the line. Click on one of the boxes and drag it to the desired length. Release the mouse button to place the end point of the line.
Select the line drawing by clicking on it. Click on the line, not an end box, and drag the line to the new location. Release the mouse button to place.
Select the line drawing by clicking on it. Press the Del (Delete) key on your keyboard. You can also right-click the line drawing and select “Delete” from the dropdown menu.
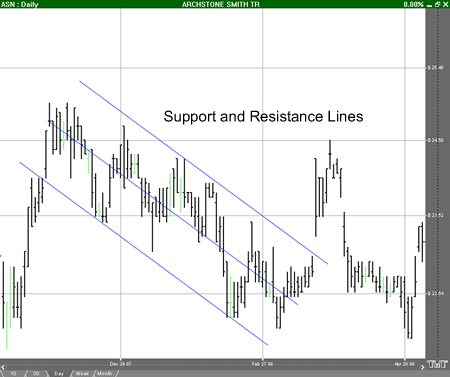
Select the line drawing by clicking on it. The properties will appear in the preferences section of your control panel. Or you can right click on a drawn line tool and select Properties.
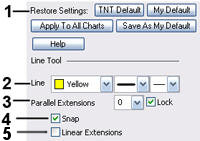
1. Restore Settings: TNT Default will change your settings back to the original software settings. My Default will change current settings to your personalized default settings. Apply To All Charts will apply your selected settings on all open charts. Save As My Default will save your current personal settings.
2. Line: From here you can choose the color, line style, and line thickness.
3. Parallel Extensions: To add parallel lines above and below the line you drew, select from the drop-down menu how many lines you would like to add. Select the checkbox by Lock to have equal space between the lines, and unselect the box if you would like to move them independently.
4. Snap: Allows the line to snap to price bars when moved.
5. Linear Extensions: Extends the line tool to the end of the graph.

Some contracts will have a continuous line, or trend, of alternating support and resistance. To illustrate these multi-lines, select the Multi-Line tool from your Charting toolbar. Click on the chart where you want your line to start. Move your mouse to the next point on your multi-line and click to place. Repeat this until the last point. When placing the last point on the multi-line, right-click to finish.
Select the multi-line drawing by clicking on it. You will know the multi-line is selected when boxes appear at the ends of the multi-line. Click on a box and drag it to your desired length. Release the mouse button to place.
Select the multi-line drawing by clicking on it. Click on the multi-line, not a box, and drag it to the new location. Release mouse button to place.
Select the multi-line drawing by clicking on it. Press the Del (Delete) key on your keyboard. You can also right-click the multi-line drawing and select “Delete” from the dropdown menu.
Select the line drawing by clicking on it. The properties will appear in the preferences section of your control panel. Or you can right click on a drawn muli line tool and select Properties.
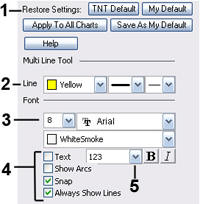
1. Restore Settings: TNT Default will change your settings back to the original software settings. My Default will change current settings to your personalized default settings. Apply To All Charts will apply your selected settings on all open charts. Save As My Default will save your current personal settings.
2. Line: From here you can choose the color, line style, and line thickness.
3. Text: Select the font, size, and color of the text. You can also choose to see numbers or letters. Select Text to hide or show your text on the chart. Select from options in the drop down dialog box to determine how you prefer to display the labeling of each point of the Multi-Line Tool.
4. Show Arcs: Select to hide/show arcs on points of the multi-line. Snap: Allow the line to snap to price bars when moved. Always Show Lines: Select to keep lines on chart even when the multi-line is unselected.

To illustrate a Rounded top or bottom formation on your futures chart, select the Arc tool in your Advanced Charting toolbar. Move the mouse pointer to the point on the chart that will be the corner of your arc. Hold the mouse button and drag to your end point. Release the mouse button to place.
The Rounded Top & Bottom formation is a very gradual change in trend.
 Rounded Top
The Rounded Top formation consists of a gradual change in trend from up to down.
 Rounded Bottom
The Rounded Bottom formation consists of a gradual change in trend from down to up. This formation is the exact opposite of a Rounded Top Formation.
 Double Top
This formation includes two distinct "tops" and anticipates a change in trend from up to down.
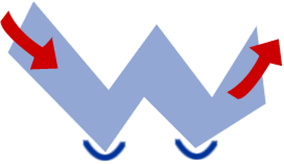 Double Bottom
This formation includes two distinct "bottoms" and anticipates a change in trend from down to up. This formation is the exact opposite of a Double Top.
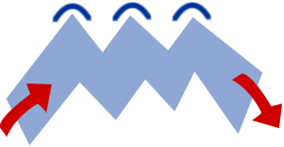 Triple Top
This formation includes three distinct "tops" and anticipates a change in trend from up to down.
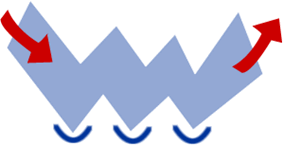 Triple Bottom
This formation includes three distinct "bottoms" and anticipates a change in trend from down to up. This formation is the exact opposite of a Triple Top.
Select the drawing by clicking on it. You will know the drawing is selected when boxes appear at the corners. Click on a box and drag it to your desired location. Release the mouse button to place.
Select the drawing by clicking on it. Drag to the new location and release the mouse button to place.
Select the drawing by clicking on it. Press the Del (Delete) key on your keyboard. You can also right-click the drawing and select “Delete” from the dropdown menu.
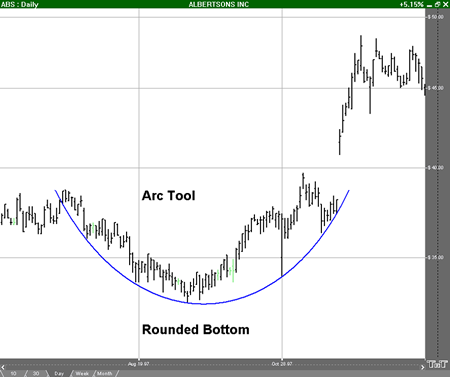
Select the drawing by clicking on it. The properties will appear in the preferences section of your control panel. Or you can right click on a drawn arc tool and select Properties.
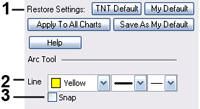
1. Restore Settings: TNT Default will change your settings back to the original software settings. My Default will change current settings to your personalized default settings. Apply To All Charts will apply your selected settings on all open charts. Save As My Default will save your current personal settings.
2. Line: From here you can choose the color, line style, and line thickness.
3. Snap: Check to have arcs drawn to snap to price bars when moved.

The Bar Calculator Tool enables you to measure the number of trading days versus actual days that are between two points on the chart. Also calculated on this tool is the number of days that the market closed high or lower in comparison with the previous day. Select the Bar Calculator Tool from your Advanced Charting toolbar. Click where you would like to start and drag the horizontal line to where you would like it to end. Release the mouse button to place.
In the futures industry trading, days are scheduled around holidays and weekends. When looking at a futures chart, it is difficult to determine how many actual days have passed while working a trade.
The number of trading days is also significant for traders using the number of trading days as a rule in conjunction with a formation. For example with the 123 Top or Bottom formation, many traders use the 10-20-50 rule. This rule defines a 123 if there are 10 trading days between the #1 and #2, and 10 days between the #2 and #3 points.
To calculate the actual(Calendar) days on a chart, use the Bar Calculator Tool.
Another statistic used alongside formations and other theories is the day higher and lower calculation. This calculation determines how many days, in a defined set of price bars, were "higher" or "lower." A day is considered a "Higher Day" if the close is higher than any previous close in the set of price bars selected. Conversely, a day is considered a "Lower Day" if the close is lower than any previous trading day in the defined set of price bars.
Select the drawing by clicking on it. You will know the drawing is selected when boxes appear at the corners. Click on a box and drag it to your desired location. Release the mouse button to place.
Select the drawing by clicking on it. Drag to the new location and release the mouse button to place.
Select the drawing by clicking on it. Press the Del (Delete) key on your keyboard. You can also right-click the drawing and select “Delete” from the dropdown menu.
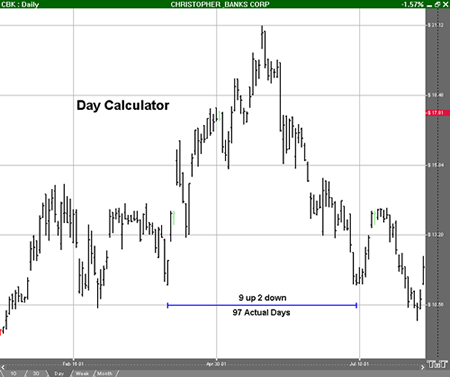
Select the drawing by clicking on it. The properties will appear in the preferences section of your control panel. Or you can right click on a drawn bar calculator tool and select Properties.
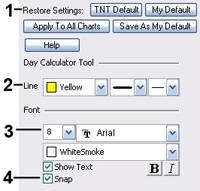
1. Restore Settings: TNT Default will change your settings back to the original software settings. My Default will change current settings to your personalized default settings. Apply To All Charts will apply your selected settings on all open charts. Save As My Default will save your current personal settings.
2. Line: From here you can choose the color, line style, and line thickness.
3. Font: Select the font, size, and color of the text. Select Show Text to hide or show your text on the chart.
4. Show Text / Snap: Select the checkbox next to Show Text to hide/show your text on the chart. Check Snap to have the Bar Calculator to snap to price bars when moved.

Use the 123 tool to chart both top and bottom formations. To draw a 123 formation, select the 123 tool from your Charting toolbar. Position the mouse pointer over the spot you would like to place the 1 point and click to place. Move to the 2 point and click to place. Move to the 3 point and click to place.
The 123 formation anticipates a change in trend. There are both top and bottom formations.
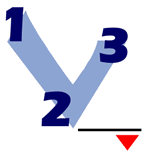 123 Top Formation
The 123 top formation anticipates a change in trend, from up to down, on a break below the number two point. This formation is easily identified because the number 1 point is the annual price high for the contract.
To trade a 123 top formation, place a sell order on a break down past the 2 point. Then place a stop loss order just above the 1 point (an industry standard) or just above the 3 point (a more conservative stop loss placement).
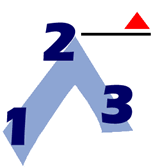 123 Bottom Formation
The 123 bottom formation anticipates a change in trend from down to up on a break above the number 2 point. A 123 bottom formation is easily identified because the number 1 point is the annual price low.
To trade a 123 bottom formation, place a buy order just above the 2 point. Then place a stop loss order just below the 1 point (an industry standard) or just below the 3 point (a more conservative placement).
Select the 123 drawing by clicking on it. You will know the 123 drawing is selected when boxes appear on the corners. Click on a box and drag it to your desired length. Release the mouse button to place.
Select the 123 drawing by clicking on it. The drawing is selected when boxes appear at the 1, 2, and 3 end points. Drag to the new location and release the mouse button to place.
Select the 123 drawing by clicking on it. Press the Del (Delete) key on your keyboard. You can also right-click the 123 drawing and select “Delete” from the drop-down menu.
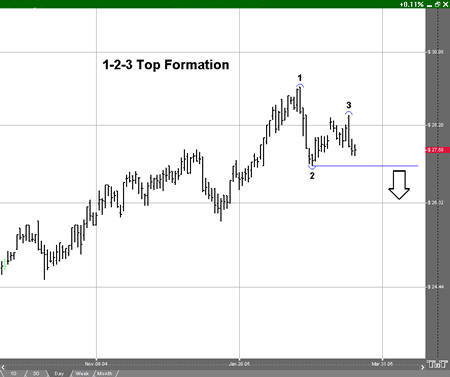
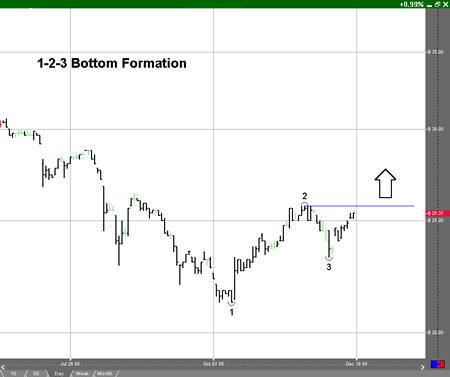
Select the 123 tool by clicking on it. The properties will show up in the preferences section of your control panel. Or you can right click on a drawn 123 tool and select Properties.
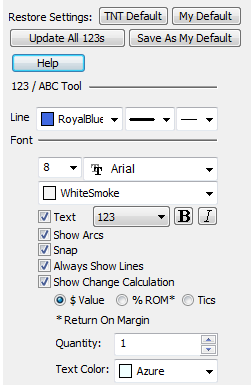
Restore Settings: TNT Default will change your settings back to the original software settings. My Default will change current settings to your personalized default settings. Apply To All Charts will apply your selected settings on all open charts. Save As My Default will save your current personal settings.
Line: From here you can choose the color, line style, and line thickness.
Font: Select the font, size, and color of the text. You can also choose to see numbers or letters. Select Text to hide or show your text on the chart.
Line Label (123): Select from different options how to label your 123 lines.
Text / Show Arcs / Snap / Always Show Lines: Select these options to display the 1-2-3 tool the way that you prefer. You can choose to hide or show Text, Arcs, Prediction, and line You can also choose whether you would like the 1-2-3 Tool to snap to price bars.
Show Change Calculation: Select to display the dollar value, percent return on margin or tics/pips value between price points 1-2 and 2-3.
Quantity: Determines the trading quantity used to calculate the $ Value, %ROM and Tics/Pips value for Change Calculation.
Text Color: Choose the color of your Change Calculation text.
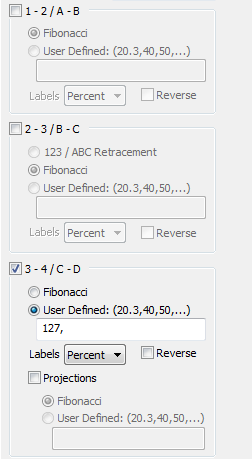 1 - 2 / A - B: Check to label distances between points 1-2.
Fibonacci: Will label Fibonacci percentage distances between points 1-2.
User Defined: Select to enter custom percentage distance markers.
Labels: Choose how you would like these values displayed within your chart. None will remove text descriptions, leaving only the line markers. Price will dispay the market price for each percentage value. Both will display both percent and market price. Reverse changes the labeling from ascending to descending.
2 - 3 / B - C: Activate to label percentage points on line 2-3.
123 / ABC Retracement: Activate to display the percent that line 2-3 retraced back through line 1-2.
3 - 4 / C - D: Creates the 123 projection line, with a 127% distance label by default. Check Fibonacci to display the default Fibonacci distance labels.
Projections: Activate to extend the 3-4 line beyond the default 127% distance.

To identify a H&S top or bottom formation, use the Head & Shoulder tool. Select the Head & Shoulders tool from your Charting toolbar. Position the mouse pointer where you would like to place the Left Shoulder (LS) point and click to place. Move to the valley point between the LS and the Head (H) and click to place. Move to the H point and click to place. Move to the valley point between the H and Right Shoulder (RS) and click to place. Move to the RS point and click to place.
This formation can appear anywhere in the chart and is made up of the Head, Left Shoulder, and Right Shoulder. There are both top and bottom formations.
 Head & Shoulders Top Formation
In this formation, the middle peak, the Head (H), is higher than either shoulder (LS, RS). This formation anticipates a drop in price below the Neckline (shown by the red arrow).
To trade a Head & Shoulders top formation, place a sell order on the break of the Neckline. Your stop loss order should then be placed just above the Head. The stop loss order can also be placed above the Right Shoulder as a more conservative point.
 Head & Shoulders Bottom Formation
This formation is an inverted version of the Head & Shoulders top formation. A Head & Shoulders bottom anticipates a rise in price above the Neckline.
To trade a Head & Shoulders bottom formation, place a buy order on the break up from the Neckline. Then place a stop loss order just below the Head. The stop loss order can also be placed below the Right Shoulder as a more conservative point.
Select the H&S drawing by clicking on it. You will know the drawing is selected when boxes appear on the corners. Click on a box and drag it to your desired length. Release the mouse button to place.
Select the H&S drawing by clicking on it. The tool is selected when boxes appear at the LS, H, and RS end points. Drag to the new location and release the mouse button to place.
Select the H&S drawing by clicking on it. Press the Del (Delete) key on your keyboard. You can also right-click the drawing and select “Delete” from the dropdown menu.
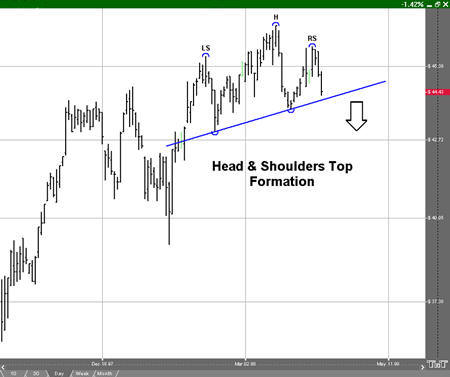
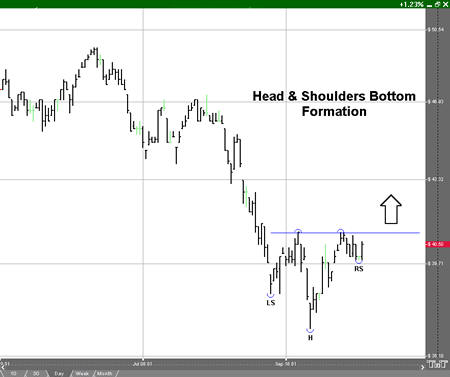
Select the H&S drawing by clicking on it. The properties will appear in the preferences section of your control panel. Or you can right click on a drawn Head & Shoulders tool and select Properties.
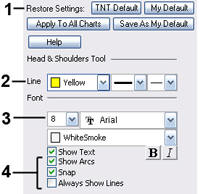
1. Restore Settings: TNT Default will change your settings back to the original software settings. My Default will change current settings to your personalized default settings. Apply To All Charts will apply your selected settings on all open charts. Save As My Default will save your current personal settings.
2. Line: From here you can choose the color, line style, and line thickness.
3. Text: Select the font, size, and color of the text. Select Show Text to hide or show your text on the chart.
4. Show Arcs: Select to hide/show arcs on points of the H&S drawing. Snap: Allows the H&S drawing to snap to price bars when moved. Always Show Lines: Select to keep lines the H&S drawings displayed always.

To chart a Dart Up or Down formation, select the Dart/Blip tool from your Advanced Charting toolbar. Click your mouse on the Left Feather (LF). Move to the Tip of the dart and click your mouse again. Click on the Right Feather to finish your dart.
The Dart/Blip formation occurs when there is a dramatic price change which is followed by an equally dramatic price change.
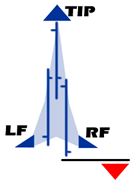
Dart Up
This formation is a sudden dramatic price increase followed by an equally dramatic drop in price. A dart formation can appear anywhere in a chart.
To trade a dart up, place a sell order on the break down of the Right Feather (RF) along with a stop loss order just above the Tip.
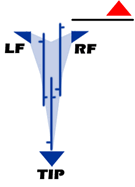
Dart Down
This formation is where a sudden dramatic price decrease occurs followed by an equally dramatic increase in price. A dart formation can appear anywhere in a chart
Place a buy order on the break up of the Right Feather, and place a stop loss order right below the Tip.
Trading on a Dart Formation is extremely risky.
Select the drawing by clicking on it. You will know the drawing is selected when boxes appear at the corners. Click on a box and drag it to your desired location. Release the mouse button to place.
Select the drawing by clicking on it. Drag to the new location and release the mouse button to place.
Select the drawing by clicking on it. Press the Del (Delete) key on your keyboard. You can also right-click the drawing and select “Delete” from the dropdown menu.
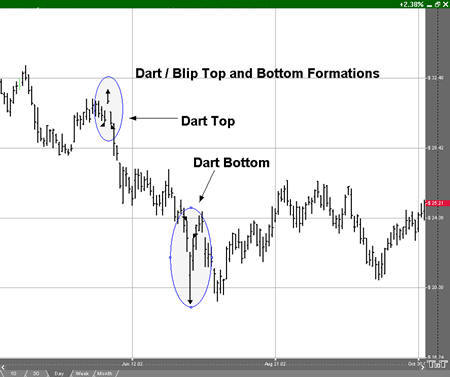
Select the drawing by clicking on it. The properties will appear in the preferences section of your control panel. Or you can right click on a drawn dart tool and select Properties.
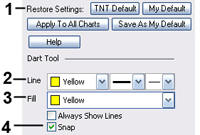
1. Restore Settings: TNT Default will change your settings back to the original software settings. My Default will change current settings to your personalized default settings. Apply To All Charts will apply your selected settings on all open charts. Save As My Default will save your current personal settings.
2. Line: From here you can choose the color, line style, and line thickness.
3. Fill: Select the color of your point triangles.
4. Always Show Lines: Select to keep dart/blip displayed always. Snap: Allows the dart/blip line to snap to price bars when moved.

Identify any type of wedge or triangle by selecting the Wedge tool from your Charting toolbar. Position the mouse pointer where you would like to place the top point of the triangle and click. Move to the bottom point of the triangle and click again. Position the mouse pointer where you would like to place the final point of the triangle and click to place.
The wedge formation occurs when the slope of price bar highs and lows consolidate to a point. The triangle formation occurs when there is a pause in the current trend.
 Inclining Wedge
The Inclining Wedge formation occurs when the slope of both lines is up with the lower line being steeper then the higher one.
To trade the Inclining Wedge, place a buy on a break up and out of the wedge or a sell order on a break down and out of the wedge. Inclining Wedges with a prior downtrend are anticipated to break down and out, rather than up and out.
 Declining Wedge
The Declining Wedge formation occurs when the slope of both lines is down, the top line being steeper then the lower one. This formation is opposite the Inclining Wedge.
Trade the Declining Wedge the same as the Inclining Wedge. Declining Wedges with a prior uptrend are anticipated to break up and out, rather than down and out.
 Symmetrical Triangle
A Symmetrical Triangle is likely to resume the previous trend after the pause forming the triangle. Notice the price bars form a perfect symmetrical triangle shape.
To trade a Symmetrical Triangle, place a buy order on a break up and out of the triangle or a sell order on a break down and out of the triangle.
 Non-Symmetrical Triangle
A Non-Symmetrical Triangle is exactly the same as the Symmetrical Triangle, except lacking symmetry. The formation resumes the previous trend when a break occurs.
Trade a Non-Symmetrical Triangle just as you would a Symmetrical Triangle.
Select the drawing by clicking on it. You will know the drawing is selected when boxes appear at the corners. Click on a box and drag it to your desired location. Release the mouse button to place.
Select the drawing by clicking on it. Drag to the new location and release the mouse button to place.
Select the drawing by clicking on it. Press the Del (Delete) key on your keyboard. You can also right-click the drawing and select “Delete” from the dropdown menu.
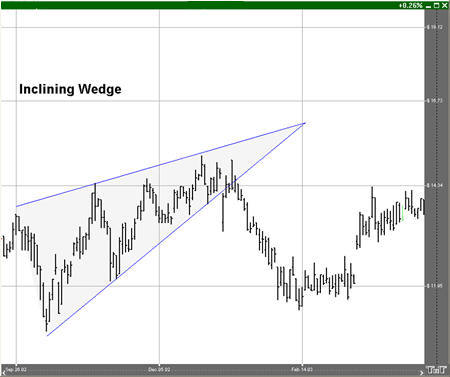
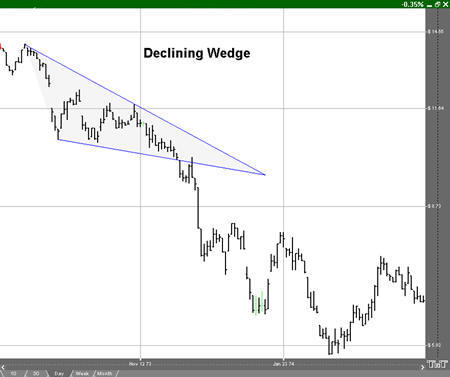
Select the drawing by clicking on it. The properties will appear in the preferences section of your control panel. Or you can right click on a drawn Wedge tool and select Properties.
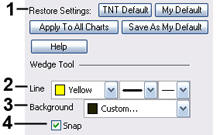 1. Restore Settings: TNT Default will change your settings back to the original software settings. My Default will change current settings to your personalized default settings. Apply To All Charts will apply your selected settings on all open charts. Save As My Default will save your current personal settings.
2. Line: From here you can choose the color, line style, and line thickness.
3. Background: Select the color you would like filled into the triangle or wedge.
4. Snap: Allows the drawing to snap to price bars when moved.

Identify a trend fan within a chart by selecting the Trend Fan tool from your Charting toolbar. Position the mouse pointer where you would like to place the main point of your trend fan. Move the mouse pointer to the end of the first line and click. Add as many lines of your trend fan as you would like. To place the last trend, position the mouse pointer at the end of the last line and right-click to place.
Trend Fans are an extension of the regular trend line. They accent simple trend line trading concepts by extending the single trend line to multiple fan lines that give a better look at a trend, its retracements, and market reversals.
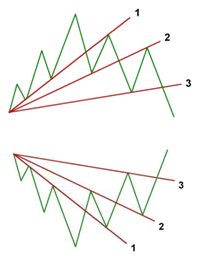
Trend Fan
As a trend moves up in scale, a chartist will draw a line across price bar lows or, when a market is moving down, across the price bar highs.
AAs the market continues to make its retracement, we can draw another trend line across the next level of support or resistance. The line is support if the market is moving up and resistance if it is moving down.
The last move of the trend was resistance for the first trend line, and is now support for the second trend line. The third trend line shows that the market has made a solid retracement down past this third fan line.
When the market crosses the third fan line, it is considered to be confirmation of market retracement. A market that was once considered bullish is now bearish, or if bearish, would now be considered bullish. When the markets price bars cross above or below the third trend fan line, this is your signal and confirmation that the market has shifted from bullish to bearish, or bearish to bullish.
To trade a Trend Fan, place an order to enter the market on the break out past the third Trend Fan line.
Select the drawing by clicking on it. You will know the drawing is selected when boxes appear at the ends of the lines. Click on a box and drag it to your desired location. Release the mouse button to place.
Select the drawing by clicking on it. Drag to the new location and release the mouse button to place.
Select the drawing by clicking on it. Press the Del (Delete) key on your keyboard. You can also right-click the drawing and select “Delete” from the dropdown menu.
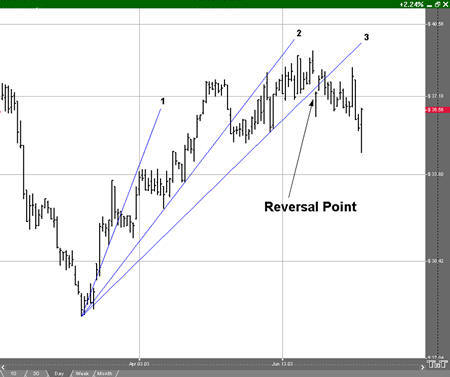
Select the drawing by clicking on it. The properties will appear in the preferences section of your control panel. Or you can right click on a drawn trend fan tool and select Properties.
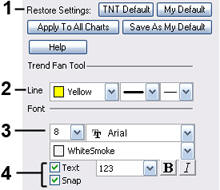
1. Restore Settings: TNT Default will change your settings back to the original software settings. My Default will change current settings to your personalized default settings. Apply To All Charts will apply your selected settings on all open charts. Save As My Default will save your current personal settings.
2. Line: From here you can choose the color, line style, and line thickness.
3. Font: Select the font, size, and color of the text. Select Text to hide or show your text on the chart.
4. Snap & Extend: Select to have the drawing snap to price bars when moved. Select Extend for linear extensions to the edge of your chart.
5. Line Label: Select from different options for labeling your trend fan lines.

Identify an Inclining or Declining Channel by selecting the Trend Channel tool from your Charting toolbar. Position the mouse pointer where you would like to place the top-left point of the channel and click. Move to the bottom-left point and click again. Move to the bottom-right point and click again. Position the mouse pointer where you would like to place the top-right final point of your channel and click to place.
A trend channel consists of a section of price bars that are between parallel support and resistance lines. There are three types of channels: the Narrow Sideways Channel, the Inclining Channel, and the Declining Channel.
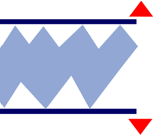 Narrow Sideways Channel
A Narrow Sideways channel is a formation that features both resistance and support with a sideways movement. Support forms the low price bar, while resistance provides the price ceiling.
To trade a Narrow Sideways channel, place an order to buy on a break up and out of the channel, or sell on a break down and out of the channel.
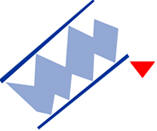 Inclining Channel
The Inclining channel is a formation with parallel price barriers along both the price ceiling and floor. Unlike the Narrow Sideways channel, the Inclining channel has an increase in both the price ceiling and price floor. The breaking of the bottom trend line on this formation shows a change in trend from bullish to bearish.
To trade an Inclining channel, place an order to sell on the break down and out of the channel.
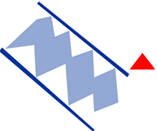
Declining Channel
The Declining channel is the exact opposite of the Inclining channel formation. The Declining channel has a decrease in both the price ceiling and price floor. The breaking of the top trend line on this formation shows a change in trend from bearish to bullish.
To trade a Declining channel, place an order to buy on the break up and out of the channel.
Select the channel by clicking on it. You will know the channel is selected when boxes appear at the corners. Click on a box and drag it to your desired location. Release the mouse button to place.
Select the channel by clicking on it. Drag to the new location and release the mouse button to place.
Select the channel by clicking on it. Press the Del (Delete) key on your keyboard. You can also right-click the channel and select “Delete” from the dropdown menu.
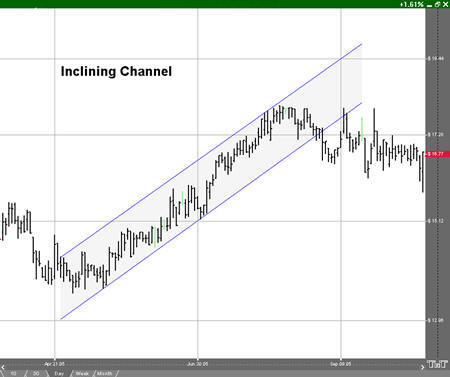
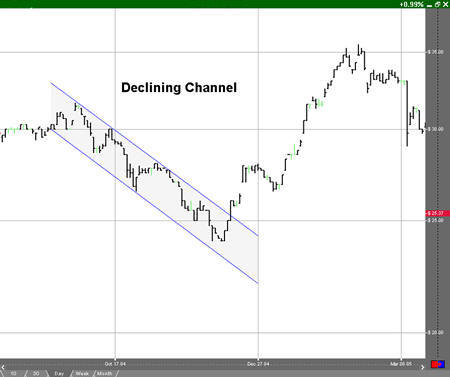
Select the channel by clicking on it. The properties will appear in the preferences section of your control panel. Or you can right click on a drawn Trend Channel tool and select Properties.
Restore Settings: TNT Default will change your settings back to the original software 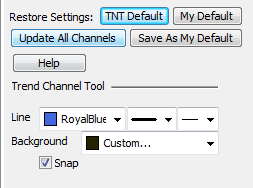 settings. My Default will change current settings to your personalized default settings. Apply To All Charts will apply your selected settings on all open charts. Save As My Default will save your current personal settings.
Line: From here you can choose the color, line style, and line thickness.
Background: Select the color you would like filled into the triangle or wedge.
Snap: Allows the drawing to snap to price bars when moved.

Illustrate a Horizontal channel in a chart by selecting the Horizontal Channel tool from your Charting toolbar. Position the mouse pointer where you would like to place the top-left point of the channel and click. Continue to hold down the mouse and drag it to the bottom-right point of your channel. Release the mouse button to place.
Select the Horizontal channel by clicking on it. You will know the channel is selected when boxes appear on the corners. Click on a box and drag it to your desired location. Release the mouse button to place.
Select the Horizontal channel by clicking on it. Drag to the new location and release the mouse button to place.
Select the Horizontal channel by clicking on it. Press the Del (Delete) key on your keyboard. You can also right-click the channel and select “Delete” from the dropdown menu.
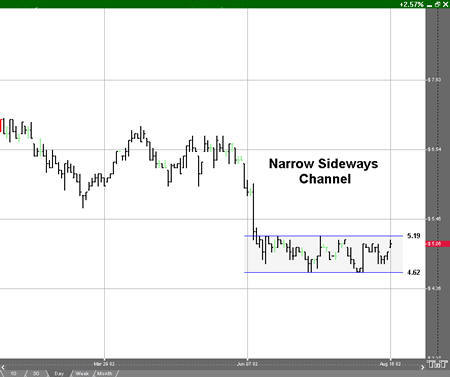
Select the Horizontal channel by clicking on it. The properties will appear in the preferences section of your control panel. Or you can right click on a drawn horizontal channel tool and select Properties.
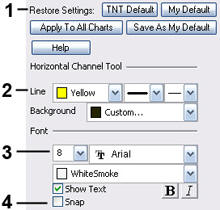 1. Restore Settings: TNT Default will change your settings back to the original software settings. My Default will change current settings to your personalized default settings. Apply To All Charts will apply your selected settings on all open charts. Save As My Default will save your current personal settings.
2. Line: From here you can choose the color, line style, and line thickness.
3. Font: Select the font, size, and color of the text. You can also choose to see numbers or letters. Select Text to hide or show your text on the chart.
4. Snap: Allows the drawing to snap to price bars when moved.

You can measure a retracement by selecting the N% tool from your Charting toolbar. Position the mouse pointer where you would like to place the top-left point of the channel and click. Continue to hold down the mouse button and drag to the bottom-right point of the channel. Release mouse button to place. The default on this charting tool is 50%. (For more information on retracements, see Fibonacci Time Zone and Fan tools in the Advanced Charting Tools section.)
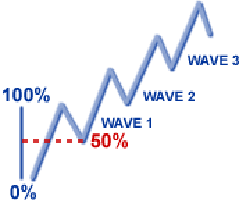 Up Trend (Bull Market)
In the diagram to the left, the market is in an overall uptrend; however, within the uptrend are small areas where the market falls back, or "retraces," each time establishing a new higher high.
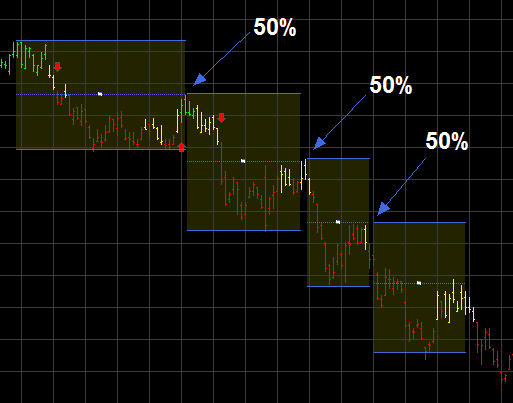 Down Trend (Bear Market)
This chart shows how the market made lower highs and lower lows, while still maintaining the overall down trend. Each retracement was about 50% of the last move before they continued on in their original direction.
Markets have a tendency to retrace half of the last move in overall long-term trends.
Select the channel by clicking on it. You will know the channel is selected when boxes appear on the corners. Click on a box and drag it to your desired location. Release the mouse button to place.
Select the channel by clicking on it. Drag to the new location and release the mouse button to place.
Select the channel by clicking on it. Notice the box in the center of the middle line. Click and drag the box to move the line. As you change the position of the percentage line, the percentage value to the left will change as well.
Select the channel by clicking on it. Press the Del (Delete) key on your keyboard. You can also right-click the channel and select “Delete” from the dropdown menu.
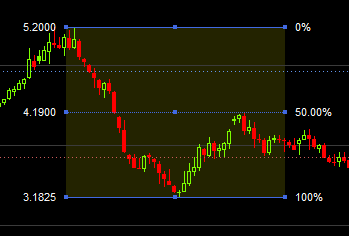
Select the channel by clicking on it. The properties will appear in the preferences section of your control panel. Or you can right click on a drawn N% ruler tool and select Properties.
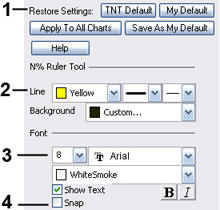 1. Restore Settings: TNT Default will change your settings back to the original software settings. My Default will change current settings to your personalized default settings. Apply To All Charts will apply your selected settings on all open charts. Save As My Default will save your current personal settings.
2. Line: From here you can choose the color, line style, and line thickness.
3. Font: Select the font, size, and color of the text. You can also choose to see numbers or letters. Select Text to hide or show your text on the chart.
4. Snap: Allows the drawing to snap to price bars when moved.
![]()
The Arrow tool enables you to draw arrows to help point out areas of interest on your chart. Position the mouse pointer where you want to place the point of the arrow and click the mouse button. Drag the mouse pointer to the location you would like to end the arrow. Release the mouse button to place.
Select the arrow drawing by clicking on it. The arrow is selected when boxes appear at the ends of the line. Click on one of the boxes and drag it to the desired length. Release the mouse button to place the end point of the line.
Select the arrow drawing by clicking on it. Click on the arrow, not an end box, and drag it to the new location. Release the mouse button to place.
Select the arrow drawing by clicking on it. Press the Del (Delete) key on your keyboard. You can also right-click the line drawing and select "Delete" from the dropdown menu.
Select the drawing by clicking on it. The properties will appear in the preferences section of your control panel. Or you can right click on a drawn arrow tool and select Properties.
![]() 1. Restore Settings: TNT Default will change your settings back to the original software settings. My Default will change current settings to your personalized default settings. Apply To All Charts will apply your selected settings on all open charts. Save As My Default will save your current personal settings.
1. Restore Settings: TNT Default will change your settings back to the original software settings. My Default will change current settings to your personalized default settings. Apply To All Charts will apply your selected settings on all open charts. Save As My Default will save your current personal settings.
2. Line: From here you can choose the color, line style, and line thickness of an arrow.
3. Arrow Fill: This option allows you to choose the fill color of the arrow point(s).
4. Arrow Point: This option allows you to choose which end you would like the arrow point to be placed. Choose from "on end one", "on end two", or "on both ends".
5. Snap: Select this option to place an arrow end directly on a price bar. You can snap to open, high, low, or close.

The Flag tool enables you to place a flag or a graphic on your chart. There is a basic set of flags available to choose from or you can import custom flags. Select the Flag tool from the Notation toolbar. Click on the chart where you would like the top of the Flag. The default flag will be placed in this location.
Select the flag drawing by clicking on it. The flag is selected when boxes appear at the corners of the graphic. Click on one of the boxes and drag it to the desired length. Release the mouse button to place.
Select the flag drawing by clicking on it. Click on the flag, not an end box, and drag it to the new location. Release the mouse button to place.
Select the flag drawing by clicking on it. Press the Del (Delete) key on your keyboard. You can also right-click the line drawing and select "Delete" from the dropdown menu.
Select the flag drawing by clicking on it. The properties will appear in the preferences section of your control panel. Or you can right click on a drawn flag tool and select Properties.
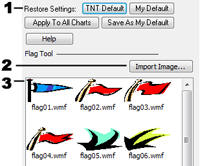 1. Restore Settings: TNT Default will change your settings back to the original software settings. My Default will change current settings to your personalized default settings. Apply To All Charts will apply your selected settings on all open charts. Save As My Default will save your current personal settings.
2. Import Image: Click on this button to import any custom image as a flag. Importable formats are .wmf, .jpeg, and .gif. Click on any of these flags to display in your chart.
3. Flag Window: This window shows a list of the default flags included in the software.
The Text tool enables you to type text on the Chart. Select the Text toll in the Notation toolbar. Click on the chart where you would like to place the upper left corner of the text box. Drag the text box to the lower right corner of your desired text box. Release the mouse button to place.
Once the box is drawn, the Text Tool Options window will open. Enter the text, set the font, size, position, color, and style of the text. Select a border and background if you would like. Click "OK" when finished and text will be place on your chart.
Select the text box by clicking on it. Continue holding down the mouse button to drag text to the new location. Release mouse button to place.
Select the text box by clicking on it. Press the Del (Delete) key on your keyboard. You can also right-click the text box and select "Delete" from the dropdown menu.
Select the text box by clicking on it. The properties will appear in the preferences section of your control panel. Or you can right click on a drawn text tool and select Properties.
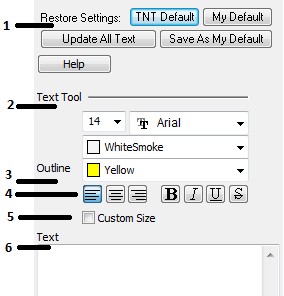
1. Restore Settings: TNT Default will change your settings back to the original software settings. My Default will change current settings to your personalized default settings. Apply To All Charts will apply your selected settings on all open charts. Save As My Default will save your current personal settings.
2. Text Tool: You can change the size, font, and color of the text.
3. Outline: Click on the down arrow to view a list of colors for the outline of the text box.
4. Alignment and Font Style: These buttons determine how you want your text to appear on the chart. You can align the text left, center, or right, and can also bold, italicize, underline, and strikethrough.
5. Custom Size: Select this check-box to manually adjust the size of the Text Tool window.
6. Text: Use the Text entry window to cut, copy, or paste information.
The Box tool enables you to draw square or rectangle shaped drawings on the chart. Select the Box tool in the Notation toolbar. Click where you would like to place the top-left corner of the box, hold down the mouse button and drag to the location of the bottom-right corner of the box. Release the mouse button to place.
Select the rectangle drawing by clicking on it. The drawing is selected when boxes appear at the corners of the graphic. Click on one of the boxes and drag it to the desired length. Release the mouse button to place.
Select the rectangle drawing by clicking on it. Click on the drawing, not an end box, and drag it to the new location. Release the mouse button to place.
Select the rectangle drawing by clicking on it. Press the Del (Delete) key on your keyboard. You can also right-click the line drawing and select "Delete" from the dropdown menu.
Select the drawing by clicking on it. The properties will appear in the preferences section of your control panel. Or you can right click on a drawn box tool and select Properties.
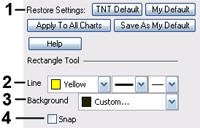 1. Restore Settings: TNT Default will change your settings back to the original software settings. My Default will change current settings to your personalized default settings. Apply To All Charts will apply your selected settings on all open charts. Save As My Default will save your current personal settings.
2. Line: Choose the color, style, and thickness of the line surrounding the box.
3. Background: Change the fill color of the box.
4. Snap: Select this option to place a box corner directly on a price bar. You can snap to open, high, low, or close.
The Circle tool enables you to draw circle shaped drawings on the chart. Select the Circle tool in the Notation toolbar. Click on the chart where you would like the circle to start. Continue holding down the mouse button and drag the tool until it has formed a circle. Release the mouse button to place.
Select the circle drawing by clicking on it. The circle is selected when boxes appear at the corners of the graphic. Click on one of the boxes and drag it to the desired length. Release the mouse button to place.
Select the circle drawing by clicking on it. Click on the box, not an end box, and drag it to the new location. Release the mouse button to place.
Select the circle drawing by clicking on it. Press the Del (Delete) key on your keyboard. You can also right-click the line drawing and select "Delete" from the dropdown menu.
Select the circle drawing by clicking on it. The properties will appear in the preferences section of your control panel. Or you can right click on a drawn circle tool and select Properties.
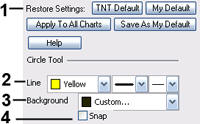 1. Restore Settings: TNT Default will change your settings back to the original software settings. My Default will change current settings to your personalized default settings. Apply To All Charts will apply your selected settings on all open charts. Save As My Default will save your current personal settings.
2. Line: Choose the color, style, and thickness of the line surrounding the circle.
3. Background: Change the fill color of the circle.
4. Snap: Select this option to place the circle directly on a price bar. You can snap to open, high, low, or close.

Use the Dollar calculator to find the dollar value between two points on the chart. Select the Dollar calculator tool from your Calculators toolbar. Click on your chart where you want the calculator to start and drag to where you want the calculation to be completed. Release the mouse button to place. The dollar amount of the chart movement will be calculated from the beginning and end point values and will be displayed in the center of the line.
Select the drawing by clicking on it. You will know the drawing is selected when boxes appear at the corners. Click on a box and drag it to your desired location. Release the mouse button to place.
Select the drawing by clicking on it. Hold down the mouse button and drag to the new location. Release the mouse button to place.
Select the drawing by clicking on it. Press the Del (Delete) key on your keyboard. You can also right-click the channel and select "Delete" from the drop-down menu.
Select the dollar calculator by clicking on it. The properties will appear in the preferences section of your control panel. Or you can right click on a drawn dollar calculator tool and select Properties.
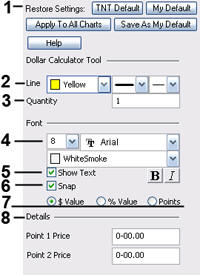
1. Restore Settings: TNT Default will change your settings back to the original software settings. My Default will change current settings to your personalized default settings. Apply To All Charts will apply your selected settings on all open charts. Save As My Default will save your current personal settings.
2. Line: Choose the color, style, and thickness of the line.
3. Quantity: Shows the number of shares/contracts included in the calculator transaction. Select and type the desired quantity to change the value.
4. Font: From here you have the ability to change the size, font, and color of the text.
5. Show Text: Uncheck this box to hide the text.
6. Snap: Select this option to place the circle directly on a price bar. You can snap to open, high, low, or close.
7. Value / % Value / *Pips *fx only: In Track n’ Trade Live Forex you can choose to display the dollar calculator as a $ Value, % Value, or as Pips.
8. Details: This section gives you the price value of Point 1 and Point 2 on the Dollar Calculator. You can modify these values by highlighting and typing a new value.

The Risk/Reward calculator is used to find the difference between two points of the risk and reward zone. Select the Risk/Reward tool on your Calculators Toolbar. Click on your chart where you want your technical formation to begin and drag to cover the area between your initial order and your risking stop loss order.
The calculator will create an equal-sized reward area that can be stretched to the proper distance you expect the graph to retrace. The numbers in the tool indicate the dollar amount of risk and reward.
When the chart is trading within the risk area (negative number), you are risking your own money. When the chart is trading within the reward area (positive number), you are risking OPM or "Other People’s Money." Use the Risk/Reward calculator on all trades to calculate where your order entries and exits should be placed.
Select the drawing by clicking on it. You will know the drawing is selected when boxes appear at the corners. Click on a box and drag it to your desired location. Release the mouse button to place.
Select the drawing by clicking on it. Hold down the mouse button and drag to the new location. Release the mouse button to place.
Select the drawing by clicking on it. Press the Del (Delete) key on your keyboard. You can also right-click the channel and select "Delete" from the drop-down menu.
Select the risk vs. reward by clicking on it. The properties will appear in the preferences section of your control panel. Or you can right click on a drawn risk vs. reward tool and select Properties.
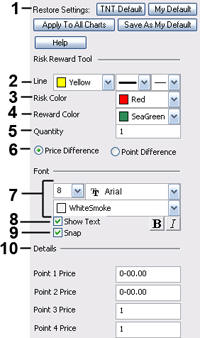
1. Restore Settings: TNT Default will change your settings back to the original software settings. My Default will change current settings to your personalized default settings. Apply To All Charts will apply your selected settings on all open charts. Save As My Default will save your current personal settings.
2. Line: Choose the color, style, and thickness of the line.
3. Risk Color: Change the highlight color of the Risk text.
4. Reward Color: Change the highlight color of the Reward text.
5. Quantity: See Dollar Calculator Preference Tab.
6. Price/Point Difference: Either view the Point or Price difference of the risk and reward calculator.
7. Font: Change the size, font, and color of the text.
8. Show Text: Uncheck this box to hide the text.
9. Snap: Select this option to place the circle directly on a price bar. You can snap to open, high, low, or close.
10. Details: This section gives you the price value of Point 1 and Point 2 on the Risk/Reward Calculator.

To identify an Elliott Wave on a chart, select the Elliott Wave tool from your Advanced Charting toolbar. Click on the first point to place. Continue throughout the wave by clicking on each point 1-5 and ABC to place. When you get to the last point, C, the drawing is complete.
The Elliott Wave theory was developed by Ralph Nelson Elliott. He suggested that the market behavior is based on waves rather than random timing. He believed that market prices rose and fell in a series of waves based on the same Golden Ratio or Golden Mean that Fibonacci proved.
Interpretation
The basic idea of the Elliott Wave theory is that a market rises in a series of five "waves" (as he called them), and a market declines in a series of three declines. Elliott’s said the market rises on the first wave, declines on the second, begins to rise again on wave three, has a period of decline again on wave four, and finally completes the rise on wave five. The period of correction is referred to as a three-wave correction where the market declines for wave A, begins to rise for wave B, and falls again for wave C.
Elliott went on to further explain that a complete market cycle consisted of a 144 wave cycle, broken down into an 89 wave bull cycle, and a 55 wave bear cycle. This is based on his observation of Fibonacci’s Golden Ratio. The series of numbers Fibonacci describes shows a relationship of 1:0.618. Elliott further showed that a market usually rises or falls based on this wave cycle. Each wave in the cycle has its own characteristics.
Five Wave Advance
One: Normally very short and easy to miss.
Two: A retracement wave. Gives back all or most of what the first one gained.
Three: Usually very prominent. Follows a period of what appears as a consolidation, most people trade this wave.
Four: Noted to be very intricate, yet still a consolidation. One of Elliott’s main rules is that in a five-wave advance cycle, wave four can’t overlap wave one.
Five: Often very active. At some point declines and lead to the three wave corrective cycle.
Three Wave Decline
A: Normally seen as a minor pullback of wave five of the advance cycle.
B: Follows A of the downtrend and is often hard to spot. Should result in a third wave continuing down.
C: Usually quite significant and many traders see this as a selling opportunity. The price bars form a perfect symmetrical triangle shape.
Select the drawing by clicking on it. You will know the drawing is selected when boxes appear at the corners. Click on a box and drag it to your desired location. Release the mouse button to place.
Select the drawing by clicking on it. Drag to the new location and release the mouse button to place.
Select the drawing by clicking on it. Press the Del (Delete) key on your keyboard. You can also right-click the drawing and select "Delete" from the dropdown menu.
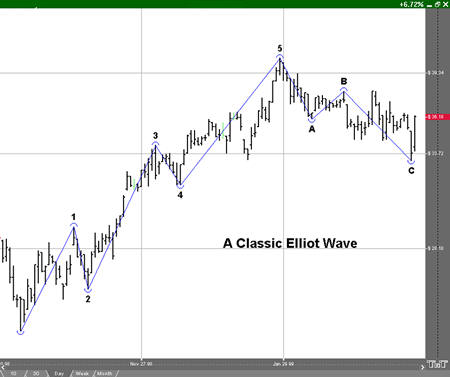
Select the drawing by clicking on it. The properties will appear in the preferences section of your control panel.
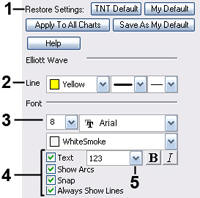 1. Restore Settings: TNT Default will change your settings back to the original software settings. My Default will change current settings to your personalized default settings. Apply To All Charts will apply your selected settings on all open charts. Save As My Default will save your current personal settings.
2. Line: From here you can choose the color, line style, and line thickness.
3. Font: Select the font, size, and color of the text. You can also choose to bold or italicize.
4. Show Text / Show Arcs/ Snap / Always Show Lines: Select the checkbox next to Text and Show Arcs to hide/show the text and arcs on the chart. Select Snap to snap the Elliot Wave Tool to price bars. Select Always Show Lines to display a line between each Elliot Wave Point
5. Points: Change how the points of the Elliot Wave are labeled from the points drop down dialog box.
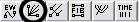
You can apply this theory to your charts by selecting the Gann Fan from drawing tools toolbar. Click where you want the Fan to start and continue to hold down the mouse button until reaching the top-right position of the fan. Release the mouse button to place.
W. D. Gann designed several techniques for studying price charts. One of these included the use of geometric angles in conjunction with time and price. Gann believed that specific geometric patterns and angles had unique characteristics that could be used to predict price action.
Gann’s techniques require that charts be drawn with equal time and price intervals, so that a rise/run of one price unit for each time unit (called a 1 x 1 trend or angle) will equal a 45 degree angle anywhere on the chart. Gann believed that the ideal balance between time and price exists when prices rise or fall at a 45 degree angle relative to the time axis.
Interpretation
A Gann Fan is used to define a market direction or a new trend. For example, a bull market exists if prices are maintaining strength between the 1x2 lower line and 1x2 higher line. A bear market would be the exact opposite of the previous scenario. The Gann Fan is made up of nine angles based on this concept. These trend lines are used to indicate support and resistance levels. When one line is broken (by the entire days price range) prices should move to the next line. The drawing of these lines should start from either a market top or bottom.
It is important to note that this theory is based on a squared 45 degree angle on the chart. Obviously, a 45 degree angle drawn on a chart is no longer 45 degrees when the scale is changed without a change to the opposite scale as well. To "square" the Gann Fan to the current chart’s scaled settings, hold down the CTRL key on your keyboard while clicking and rescaling with the mouse pointer. Some Gann experts have reported that to get a truly "squared" chart, one must set the scaling to 8 price bars per inch for the width and 4 price bars per inch for the height.
Select the drawing by clicking on it. You will know the drawing is selected when boxes appear at the corners. Click on a box and drag it to your desired location. Release the mouse button to place.
Select the drawing by clicking on it. Drag to the new location and release the mouse button to place.
Select the drawing by clicking on it. Press the Del (Delete) key on your keyboard. You can also right-click the drawing and select “Delete” from the dropdown menu.
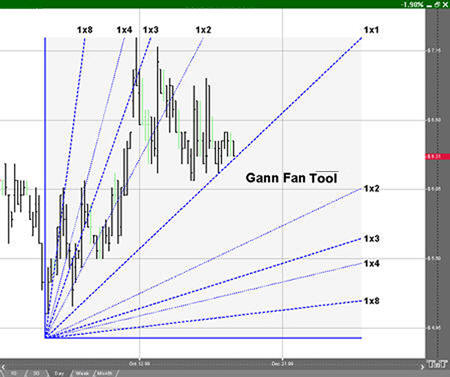
Select the drawing by clicking on it. The properties will appear in the preferences section of your control panel.
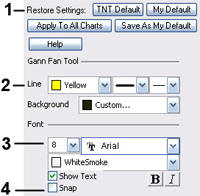 1. Restore Settings: TNT Default will change your settings back to the original software settings. My Default will change current settings to your personalized default settings. Apply To All Charts will apply your selected settings on all open charts. Save As My Default will save your current personal settings.
2. Line: From here you can choose the color, line style, and line thickness.
3. Font: Select the font, size and color. You can also choose to bold or italicize your text.
4. Snap: Select to have the drawing snap to the price bars.

You can apply this theory to your charts by selecting the Andrews Pitchfork from your drawing tools toolbar. Click where you want the handle of the pitchfork to be (at the end of the previous trend). Your next two clicks will form the base of the fork, or the tops of the next two trends. You can elongate the pitchfork to the length desired. Click to place.
Dr. Alan Andrews developed a channel technique to show areas of support and resistance from a baseline. This use of a median line is the key to using the Andrews Pitchfork. Buying near lows and selling near highs that are identified by the "tines" of the pitchfork. The basic premise is to trade the channel from one level of support or resistance to the next.
Interpretation
The first element to draw the Andrews Pitchfork is the centerline. The middle tine, or median line, begins at the most recent contract low or high. To plot the direction of this point we must attain the other two points. The top tine is determined by looking at the highest move made from the origin of the contract low or high. The next point is found by looking at the retracement of that move. For example, a contract begins at point A, rallies to point B, and sells off from point B to point C. A line is drawn from point B to point C, and the line originating at point A splits those two lines equally.
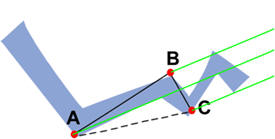 This pitchfork shows continuing points of support and resistance. The general use of this tool is to sell when the market rises to line B, take profits once prices reach line A, and buy when prices dip to line C. This series of movements within the pitchfork affords traders the opportunity to trade a channel system within a trending market.
Select the drawing by clicking on it. You will know the drawing is selected when boxes appear at the corners. Click on a box and drag it to your desired location. Release mouse button to place.
Select the drawing by clicking on it. Drag to the new location and release the mouse button to place.
Select the drawing by clicking on it. Press the Del (Delete) key on your keyboard. You can also right-click the channel and select “Delete” from the dropdown menu.
Distance scaling is determined from the starting point of the Pitchfork handle to the middle cross line.
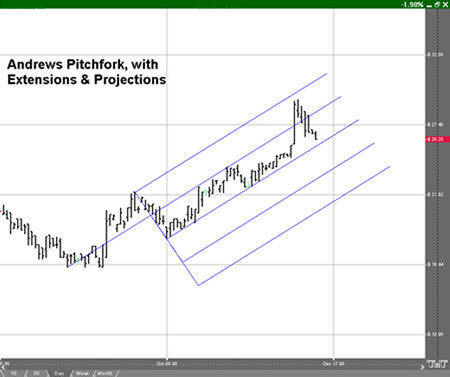
Select the drawing by clicking on it. The properties will appear in the preferences section of your control panel.
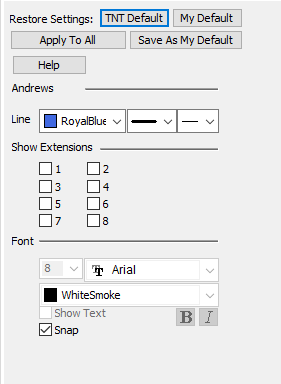 Restore Settings: TNT Default will change your settings back to the original software settings. My Default will change current settings to your personalized default settings. Apply To All Charts will apply your selected settings on all open charts. Save As My Default will save your current personal settings.
Line: From here you can choose the color, line style, and line thickness.
Show Extensions: Select the box next to the number of extensions you wanted added to your pitchfork drawing. The odd numbers are placed below, even numbers are placed above.
Font: Select the font, size of font, and color of the text. You can also choose to bold or italicize your text. Select the checkbox next to Show Text to hide/show your text on the chart.
Snap: Allows the tool to snap to price bars when moved.
To measure the different retracement levels within a market, select the Fibonacci Ruler tool from your drawing tools toolbar. Click on the chart where you would like the ruler to begin. Hold the mouse button down and move to the lower right position of the rule. Release the mouse button to place.
Fibonacci Retracement levels correspond with percentage retracements that occur in the ebb and flow of a market trend. According to the Elliott Wave Theory, market trends tend to occur in five distinct waves. See the Elliott Wave section for more information. Elliott asserted that these counter-trend waves will usually retrace against the trending waves by 38.2, 50, and 61.8 percent. These retracement percentages correspond to natural ratios discovered by the Greeks called the Golden Ratio and rediscovered by Fibonacci, a medieval Italian Mathematician.
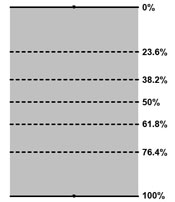 Interpretation
Commodity prices will frequently consist of an initial wave, a second wave (often retracing 61.8% of the initial move), a third wave (usually the largest), another retracement, and finally a 5th wave (the last gap), which would exhaust the movement.
In Track ‘n Trade Live, you have three tools that you can use to apply these concepts: Fibonacci Retracement, Fibonacci Time Zones, and Fibonacci Arc.
Select the drawing by clicking on it. You will know the drawing is selected when boxes appear at the corners. Click on a box and drag it to your desired location. Release mouse button to place.
Select the drawing by clicking on it. Drag to the new location and release the mouse button to place.
Select the drawing by clicking on it. Press the Del (Delete) key on your keyboard. You can also right-click the drawing and select “Delete” from the dropdown menu.
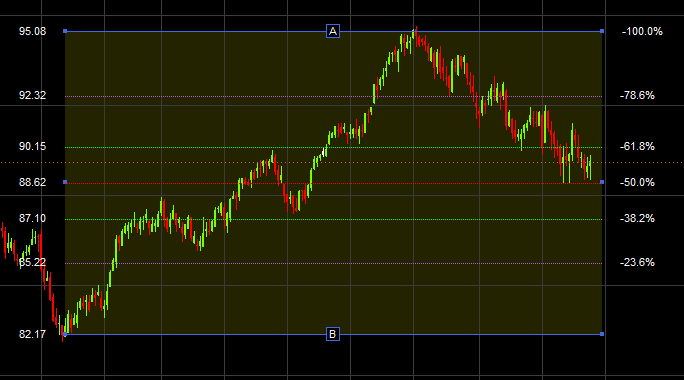
With your Preferences Tab open, select the drawing by clicking on it. The properties will appear in the preferences section of your control panel. You may also right-click the drawing and select Properties to open the Fibonacci Ruler preferences within the Preferences Tab.
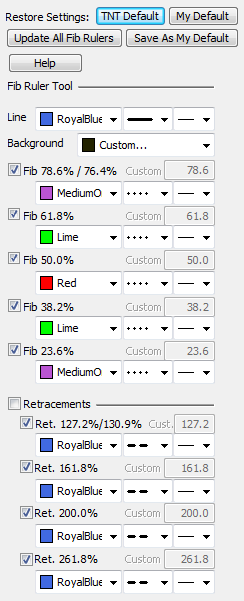 Restore Settings: TNT Default will change your settings back to the original software settings. My Default will change current settings to your personalized default settings. Apply To All Charts will apply your selected settings on all open charts. Save As My Default will save your current personal settings.
Line: From here you can choose the color, line style, and line thickness
Background: Select the color you want for the background of the Fibonacci Ruler.
Fib: Default Fibonacci Ruler. Check, blue square, or uncheck to show, customize or hide Fibonacci lines.
Retracements: Check Retracements to display Fibonacci retracements values on your drawn Fibonacci Ruler.
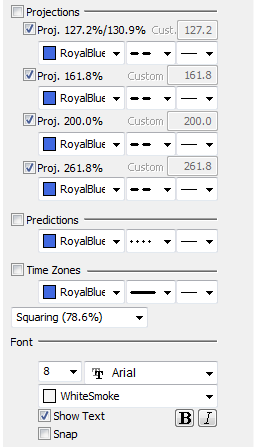 Projections: Check Projections to display Fibonacci projection values on your drawn Fibonacci Ruler.
Predictions: Check Predictions to display Fibonacci prediction values on your drawn Fibonacci Ruler.
Time Zones: Check Time Zones to display Fibonacci time zone values on your drawn Fibonacci Ruler.
Squaring / Division: Choose between displaying the Fibonacci Ruler being calculated as squared (78.6%) or displaying it as a division (76.4%).
Font: Select the font, size of font, and color of the text. You can also choose to bold or italicize your text. Select the checkbox next to Show Text to hide/show your text on the chart.
Snap: Select to have the Fibonacci Ruler snap to price bars when moved.
 Checked: line will appear with default Fibonacci values.
 Blue square: line will appear with option to enter custom percentage value.
 Unchecked: line will not appear within Fibonacci Ruler on chart.
To measure the different retracement levels within a market, select the Fibonacci Arc tool from your drawing tools toolbar. Move the mouse pointer to the point on the chart that will be the corner of your arc. Hold the mouse button and drag to your end point. Release the mouse button to place.
Select the drawing by clicking on it. You will know the drawing is selected when boxes appear at the corners. Click on a box and drag it to your desired location. Release the mouse button to place.
Select the drawing by clicking on it. Drag to the new location and release the mouse button to place.
Select the drawing by clicking on it. Press the Del (Delete) key on your keyboard. You can also right-click the drawing and select “Delete” from the dropdown menu.
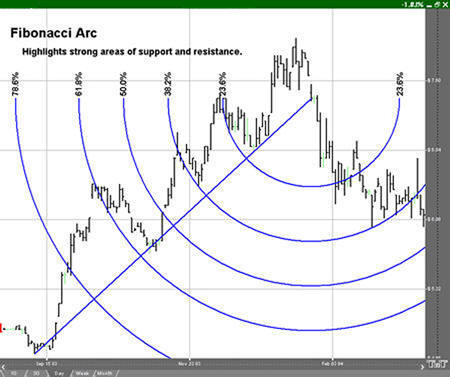
Select the drawing by clicking on it. The properties will appear in the preferences section of your control panel.
1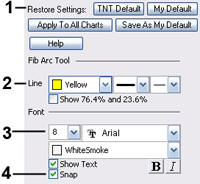 . Restore Settings: TNT Default will change your settings back to the original software settings. My Default will change current settings to your personalized default settings. Apply To All Charts will apply your selected settings on all open charts. Save As My Default will save your current personal settings.
2. Line: From here you can choose the color, line style, and line thickness.
3. Font: Select the font, size of font, and color of the text. You can also choose to bold or italicize your text. Select the checkbox next to Show Text to hide/show your text on the chart
4. Snap: Select to have the tool snap to price bars when moved.
The Fibonacci Time Zone uses Fibonacci numbers rather than the percentages used in the Ruler and Arc tools. Select the Fibonacci Time Zones from your drawing tools toolbar. Click where you want the upper left point. Hold the mouse button and drag to the bottom right position. Release the mouse button to place.
Select the drawing by clicking on it. You will know the drawing is selected when boxes appear at the corners. Click on a box and drag it to your desired location. Release the mouse button to place.
Select the drawing by clicking on it. Drag to the new location and release the mouse button to place.
Select the drawing by clicking on it. Press the Del (Delete) key on your keyboard. You can also right-click the drawing and select “Delete” from the dropdown menu.
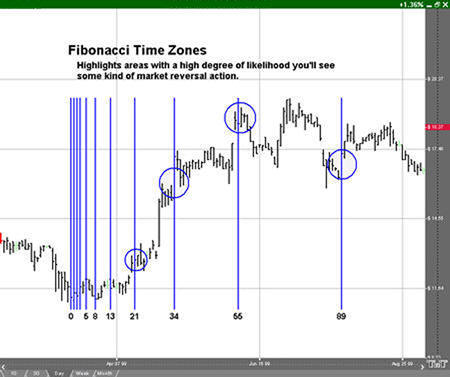
Select the drawing by clicking on it. The properties will appear in the preferences section of your control panel.
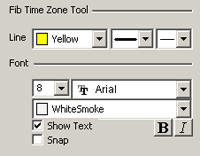 Restore Settings: TNT Default will change your settings back to the original software settings. My Default will change current settings to your personalized default settings. Apply To All Charts will apply your selected settings on all open charts. Save As My Default will save your current personal settings.
Fib Time Zone Tool: You can choose the color, line style, and line thickness of your lines.
Font: Select the font, size, and color of the text. Select Show Text to hide or show your text on the chart.
Select Snap to have your lines snap to price bars when moved.
Each toolbar can be customized to fit your trading needs. To customize a toolbar, place mouse over the toolbar and right click, then select Customize Toolbar.
To add buttons, select desired buttons and click Add. To delete unwanted buttons, select and click Remove. To restore default buttons, click Reset. When you have made your changes, select Close to save your changes and return to the program.
Tools not on by default:
Flag Tool: Used to place a flag or graphic.
Overlays are shown directly on the chart.
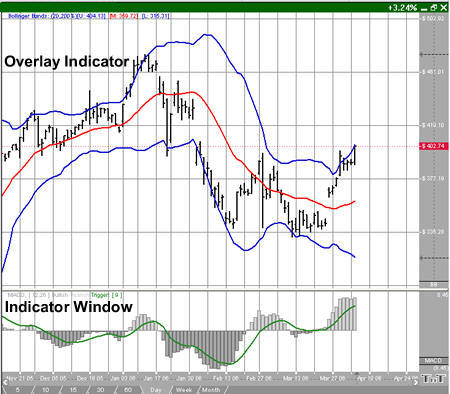
To display an Overlay Indicator, right-click the Chart Window and select Chart Overlays. Select the name of the Overlay Indicator that you would like to view from the dropdown menu. A checkmark will appear next to any indicators you have selected and all selected indicators will show directly on your chart, not in the indicator window. To remove an overlay indicator from your chart, click on the indicator in the dropdown menu again and the checkmark with disappear.
The Overlays that come from plug-ins are listed at the top of the menu, these are further discussed in the Plug-Ins section of this manual.
Overlay Preferences (Quick Links)
In the bottom right of the chart you will see symbols that will correlate with which Overlays you have selected. If you click these symbols the control panel will switch to the preferences tab automatically with the preferences of that overlay displayed. These symbols abbreciations are included in the title of the Overlays in the manual with parenthesis.
You may right-click the abbreviated names to Remove the overlay, open Chart Preferences or view Properties for that overlay.
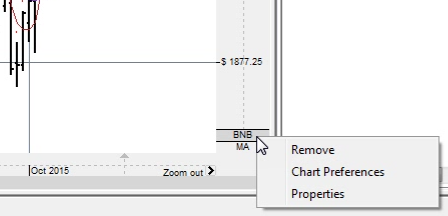
You can also navigate to the preferences of each overlay by right clicking on the chart and go to Overlay Preferences and selecting the appropriate Overlay.
On Screen Text
When you open an overlay you will see text appear on your chart in the upper left hand corner. You can choose whether to show this text, and choose where it appears by right-clicking on your chart. Mouse over On Screen Text to view your options. This also changes how indicator on screen text is displayed.
The Overlays are explained in detail in the following sections:
A unique use of fractal geometry and nonlinear dynamics is used to create the method of calculations for the Alligator Indicator. Used in combination with the Gator Indicator, the Alligator has proved to be effective at pinpointing large market trends.
Components
Alligator’s Jaw (blue line): The Balance Line for the timeframe that was used to build the chart (13 period Smoothed Moving Average, moved into the future by 8 bars).
Alligator’s Teeth (red line): The Balance Line for the value timeframe of one level lower (8 period Smoothed Moving Average, moved by 5 bars into the future).
Alligator’s Lips (green line): The Balance Line for the value timeframe, one more level lower (5 period Smoothed Moving Average, moved by 3 bars into the future).
The Lips, Teeth, and Jaw of the Alligator show the interaction of different time periods. As clear trends can be seen only 15 to 30 percent of the time, it is essential to follow them and refrain from working on markets that fluctuate only within certain price periods.
When the Jaw, Teeth and Lips are closed or intertwined, the Alligator is going to sleep or is asleep already. As it sleeps, it gets hungrier and hungrier: the longer it sleeps, the hungrier it will be when it wakes up. The first thing it does after it wakes up is to open its mouth and yawn. Then the smell of food comes to its nostrils: flesh of a bull or flesh of a bear, and the Alligator starts to hunt it. Having eaten enough to feel quite full, the Alligator starts to lose interest in the food/price (Balance Lines join together), and this is the time to fix the profit.
Alligator Example:
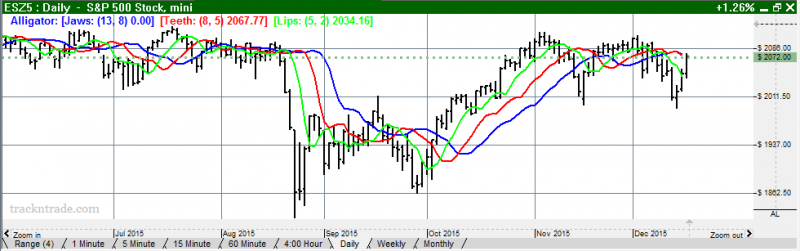
To open the Alligator Preferences click on the QuickLink (AL) in the lower right of the chart. Or you can right click, select Overlay Properties and then Alligator. If you click on the chart, the Preferences tab will go back to chart settings.
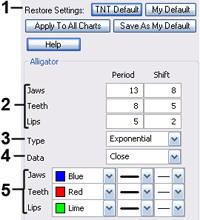 1. Restore Settings: TNT Default will change your settings back to the original software settings. My Default will change current settings to your personalized default settings. Apply To All Charts will apply your selected settings on all open charts. Save As My Default will save your current personal settings.
2. Jaws, Teeth, Lips: Specify your periods and shift specifications.
3. Type: Select Simple, Linear Weight, or Exponential.
4. Data: Select Open, High, Low, or Close.
5. Jaws, Teeth, Lips: Choose the color, line style, and line thickness of your indicator line.
John Bollinger created Bollinger Bands in an effort to gauge the volatility and condition of a market. These bands are used to determine the trading range and give an indication of when to buy and when to sell. Bollinger Bands are also used to indicate market volatility, the wider the bands the greater the volatility. Inversely, the narrower the bands, the lesser the volatility. By plotting two lines at an interval around a moving average, Bollinger bands give a good indication of market conditions and price relation. The moving average which the band is based on works as an indicator to confirm trade signals.
Calculate the moving average with this formula:
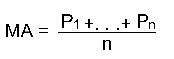
Subtract the moving average from each of the individual data points used in the moving average calculation. This gives you a list of deviations from the average. Square each deviation and add them all together. Divide this sum by the number of periods you selected.

Take the square root of d. This gives you the standard deviation.
Compute the bands by using the following formulas:
Pn: The price you pay for the nth interval.
n: The number of periods you select.
A buy signal occurs when a chart bottom is below the lower band followed by a bottom above the lower band. A sell signal occurs when a chart top is above the uppermost band followed by another top that is below the upper band.
Example of Bollinger Bands
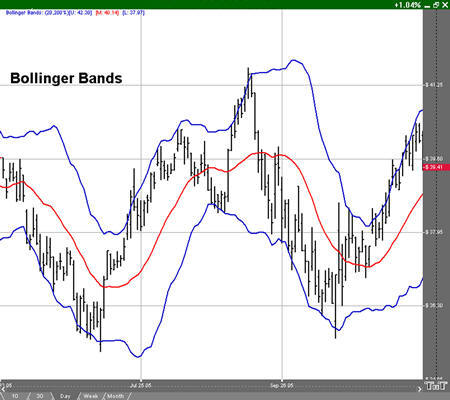
To open the Bollinger Bands Preferences click on the QuickLink (BB) in the lower right of the chart. Or you can right click, select Overlay Properties and then Bollinger Bands. If you click on the chart, the Preferences tab will go back to chart settings.
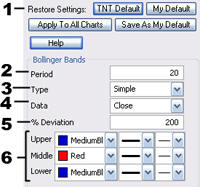 1. Restore Settings: TNT Default will change your settings back to the original software settings. My Default will change current settings to your personalized default settings. Apply To All Charts will apply your selected settings on all open charts. Save As My Default will save your current personal settings.
2. Period: To specify the number of days used in calculating the indicator, click in the box, highlight the number, and type in a new value.
3. Type: Change the type of the Moving Average line to simple, linear weight, or extra smoothed.
4. Data: Choose either open, high, low, or close as the data used in calculating the moving average.
5. % Deviation: Defines the displacement between the Bollinger Bands. Click in the box, highlight the number and type a new value to change the displacement.
6. Upper, Middle and Lower Band Lines: Change the color, line style, and line thickness of the Bollinger Bands.
Donchian Channels were created by Richard Donchian, an expert in trends. The DON is a simple trend breakout system. The channel works well in trending markets, but not as well in sideways moving markets.
Donchian Channels measure volatility by creating two bands based on the highest high and lowest low for a specified period. Many traders view the market crossing above the upper band as a signal to buy and the market crossing below the lower band as a signal to sell.
The calculation of the DON is here:
Donchian Channel High = MAX (HI, n)
Donchian Channel Low = MAX (LO, n)
n: The number of periods you select.
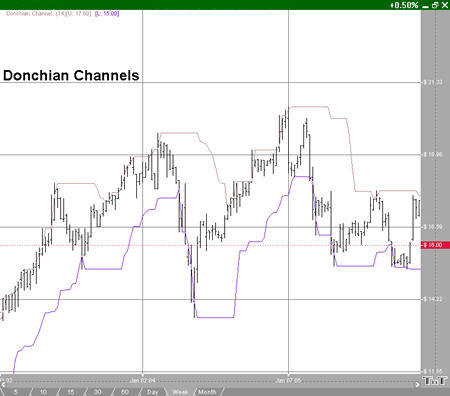
To open the Donchian Channel Preferences click on the QuickLink (DON) in the lower right of the chart. Or you can right click, select Overlay Properties and then Donchian Channels. If you click on the chart, the Preferences tab will go back to chart settings.
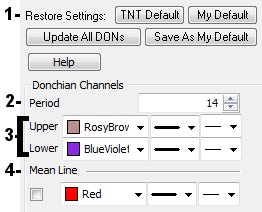
1. Restore Settings: TNT Default will change your settings back to the original software settings. My Default will change current settings to your personalized default settings. Apply To All Charts will apply your selected settings on all open charts. Save As My Default will save your current personal settings.
2. Donchian Period: Specify the number of bars in a period.
3. Upper, Lower: Choose the color, line style, and line thickness of your indicator line. Upper is the line formed by the highest high in the period specified. Lower is the line formed by the lowest low in the period specified.
4. Mean Line: Graph a line that is the midpoint between the upper and lower.
The middle line (20 period EMA) in a rising market should provide support. In a falling market, the middle line should provide resistance. Keltner Bands, as with any moving average indicator, seem to work great in strongly tending markets, but not so well in sideways markets. Just like all trend-following systems, the Keltner Bands are not meant to spot tops or bottoms. Use the Keltner Bands in conjunction with other indicators such as RSI or MACD. Using it in combination with either of these will help provide verification of the strength of a market.
The calculation for the top, or Plus Band, is here:
2 (ATR over 10 periods) + (20 period exponential moving average)
The calculation for the bottom, or Minus Band, is here:
2 (ATR over 10 periods) - (20 period exponential moving average
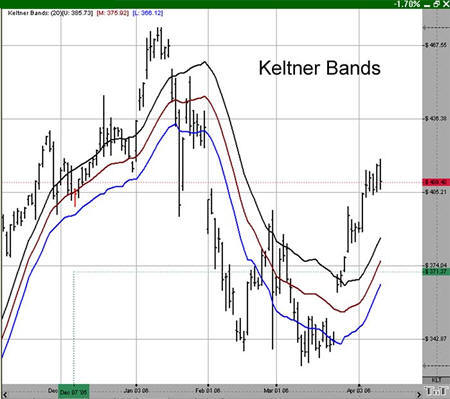
To open the Keltner Bands Preferences click on the QuickLink (KLT) in the lower right of the chart. Or you can right click, select Overlay Properties and then Keltner Bands. If you click on the chart, the Preferences tab will go back to chart settings.
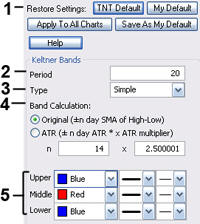 1. Restore Settings: TNT Default will change your settings back to the original software settings. My Default will change current settings to your personalized default settings. Apply To All Charts will apply your selected settings on all open charts. Save As My Default will save your current personal settings.
2. Period: Specify the number of days used.
3. Type: Select Simple, Linear Weight, or Exponential.
4. Band Calculation: Select Original or ATR and enter values of your own.
5. Upper, Middle, Lower: Choose the color, line style, and line thickness of your indicator line.
The moving average, or simple moving average, represents the average of the last several closing prices. The moving average is simple to compute, easy to understand, and reliable under tests. This simplicity is the strength of the moving average.
The basic moving average is computed the same as any other mathematical average. The most common way of determining the moving average of a market is to take the closing price over a certain number of days, add them together, and divide by the select number of days.
Moving averages are generally thought to be indicators of trend. For example, conventional interpretation is that once prices cross from below the moving average to above it, the trend is considered up. On the other hand, if prices go from above the moving average to below it, the trend of the market is considered down.
The purpose of the simple moving average is to track the progress of the trend. Moving averages can potentially keep you in the trend for a long time. The moving average gives you an indication of the trend being up (prices above the moving average) or down (below the moving average). However, the moving average gives you no indication of the length or duration of the trend.
Double moving averages use two different averages in tandem. The first average is generally a faster reacting average using a shorter period of time, usually 10 days. The second average is a slower reacting average that will indicate longer-term price movement.
Using these two averages together helps to alleviate whipsaws by giving a basis of comparison. The faster average breaking above the slower average is a buy signal, the faster average breaking below the slower average is a sell signal.
When using two different moving averages the trader gets a clearer picture of price indications. By combining a slower moving 20-day average, with a quicker reacting 10-day average, you can see where the long-term indications are going.
You would sell once the faster moving average crosses below the slower trend because that’s an indication of change in trend. Near-term prices should be rising at a greater rate than longer-term prices in a good upward trending market, and vice versa for a down trend.
The system of triple moving averages is employed by plotting three different moving averages together. The first of these averages is a faster average that only looks at the short-term price direction. The second average is a medium average that reacts to a longer period of time, but not as long as the final average. The third average is the slowest to react, because it takes an average of the longest period of time.
A 10, 20, and 40 day moving average system would be considered a triple moving average. The first average, the 10-day, is the quickest to move when prices show a change. The second average, the 20-day, is the medium average that does not show change until the prices have moved for a longer period of time. Finally the slowest moving of the averages is the 40-day. This slow average will not indicate a difference until prices have made a significant move. Shorter-term moving averages, being more sensitive to changes in price, are said to follow the trend more closely. The middle or medium average would follow less closely and the slowest or least sensitive average would lag the most.
The use of the triple moving average is to buy when all three averages move to be in an upward trend or to sell when these averages are in a downtrend. The upward trend appears when the fastest average is higher than both of the other averages, the medium is above the slowest, and the longer term moving average is on the bottom.
This look would be reversed for a strong down trend with slow average on top, followed by the medium average, and the fastest on bottom.
Simple Calculation:
Mat = (P1 +... + Pn) / n
Mat: The moving average for the current period.
Pn: The price for the nth interval.
n: The length of the moving average.
Compute the average of the past n intervals using the price specified for that period. Now use real values to compute a five interval moving average. If you assume the following prices, the calculations are here:
MA = (7380 + 7375 + 7385 + 7390 + 7395) / 5
= 36925 / 5
= 7385
Linearly Weighted Calculation:
Mat = [(P1 x (n –1)] + …+ [Pn x (n – n)]
Denom = n + n-1 + n-2 +…+ 1
MA = Mat / Denom
n: The length of the moving average.
Pn: The price for the nth interval.
MA: The moving average for the current period.
Exponential Calculation:
fPerc = 2 / (n + 1)
MAt = (P x fPerc) + [MA(t-1) x (1 – fPerc)]
MA: The moving average for the current period.
t: The current time period.
Max Average Calculation (found below moving average 6):
Max Ave. = Sum of ( nclose * npos ^ pow ) / sum of ( npos ^ pow )
npos: position in the period, starting at 1
nclose: close of the bar at npos
pow: Max Average Power
Moving Average signals are calculated from the first 2 moving average lines. A buy signal occurs after the Moving Average 1 moves above Moving Average 2. A sell signal occurs after the Moving Average 1 moves below Moving Average 2.
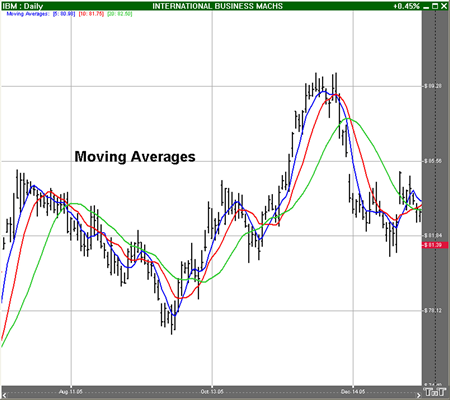
Open the Preference tab from the Control Panel on the left of your screen. Select the moving average line on your screen. The preferences will appear in the Control Panel. (Once you click on the chart, the Preference tab will go back to chart settings.)
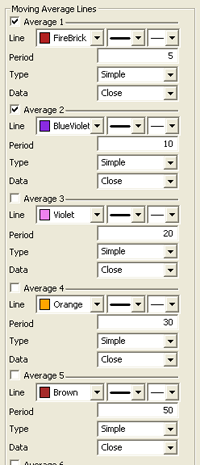 Restore Settings: TNT Default will change your settings back to the original software settings. My Default will change current settings to your personalized default settings. Apply To All Charts will apply your selected settings on all open charts. Save As My Default willsave your current personal settings.
Line: Choose the color, line style, and line thickness of your indicator line.
Period: The number of bars, or interval, used to calculate the moving averages. To add a displacement, add a second number in the period box (with only a space between the two numbers.)
Type: Select Simple, Linear Weight, or Exponential.
Data: Select Open, High, Low, Close, Mean, Median, or Mode.
The Parabolic SAR, developed by Welles Wilder, creator of RSI and DMI, sets trailing price stops for either long or short positions. Also referred to as the stop-and-reversal indicator, Parabolic SAR is more popular for setting stops than for establishing direction or trend. Wilder recommended establishing the trend first, and then trading with Parabolic SAR in the direction of the trend. If the trend is up, but the underlying price drops back below the trailing PSAR indicator, then sell or liquidate your long position. If the trend is down, and the underlying price rises above the trailing PSAR indicator then buy or liquidate your short position.
Calculation
Once the market establishes a direction, the initial SAR becomes the extreme price for the two intervals. The extreme price is either the lowest price or highest price for the two trading intervals. The short position uses the high, and the long position uses the low.
The calculation for the PSAR is here:
SARt = SARt-1 + [ a x ( EPtrade - SARt-1) ]
SARt: The stop and reverse price for the current interval.
SARt-1: The stop and reverse price for the previous interval.
a: The acceleration factor.
EPtrade: The extreme price for the trade.
The SAR is always the “stop and reverse” price point. This is the point you would want to liquidate your current position and establish the opposite position.
The acceleration factor, a, is a weighting factor. In Wilder’s work, the initial value for the acceleration factor is .02. The acceleration factor increases by a value of .02 each time the extreme price changes for the trade. You do not increment the acceleration factor if the extreme price fails to change. The value for a, the acceleration factor, never exceeds .20 in Wilder’s methodology.
The extreme price (EP) for the trade is the highest or lowest price achieved during the trade. If you have a long position, use the new highs as the extreme price. When you have a short position, use the new lows as the extreme price. The extreme price concept allows for normal market corrections without immediately triggering the SAR price. It keeps the SAR price moving in the direction of the market.
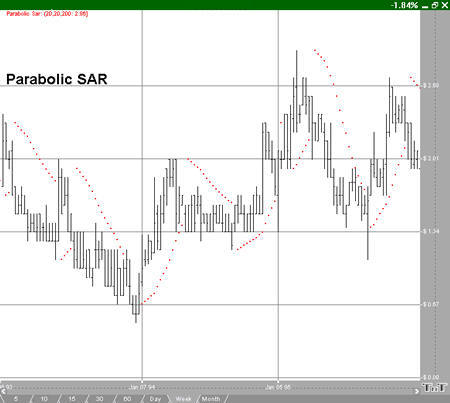
To open the Parabolic Stop and Reversal Preferences click on the QuickLink (PSAR) in the lower right of the chart. Or you can right click, select Overlay Properties and then Parabolic Stop and Reversal. If you click on the chart, the Preferences tab will go back to chart settings.
1. Restore Settings: TNT Default will change your settings back to the original software settings. My Default will change current settings to your personalized default settings. Apply To All Charts will apply your selected settings on all open charts. Save As My Default will save your current personal settings.
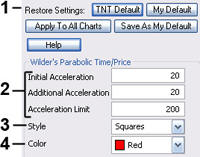 2. Initial, Additional, Limit: Specify the calculation number you would like each section of the indicator.
3. Style: Choose how you would like the indicator displayed. Select squares, crosses, dots, or lines.
4. Color: Select the color of the indicator.
However, many traders believe that once one point is violated, the next point will be tested, making a violation of these support and resistance levels a clue in trend following. Though we cannot vouch for the truth of this statement, the popularity of pivot points amongst floor traders tends to make these points worth watching.
The popularity of these numbers can be seen on any day when the exchanges are cleaned-up. The trading floor is literally piled high with folded pieces of paper that contain pivot points calculated on them.
The uses of pivot points varies greatly by trader. The most common function of the daily pivot is as a guide. If prices are trading above the pivot point, then the trend is considered up. Traders may wish to take short-term positions on a violation of the daily pivot to the upside with an initial upside objective of the first resistance level. If prices stall or slow at the first resistance level, then aggressive traders may wish to take profits. However, if the first Resistance level is violated to the upside, then the market should go on to test the second resistance level. If prices have violated the 1st resistance level, then this level should act as support on future pullbacks, as should the pivot point.
The opposite is true for support levels. A violation of the daily pivot to the downside indicates that the daily trend is down, with a downside target being the first support level. If the market stalls, then traders may wish to take profits on short positions, or initiate long positions in anticipation of a retracement to the daily pivot. However, if the first support level is violated, the day is said to be a strongly down trending day, and as such should move down further to test the second support level. As with the resistance numbers, the support numbers, once violated, become resistance lines to trade with in the trend.
Though originally used as a means for floor trading, longer-term traders can use pivot points for longer periods. Try plotting the weekly pivot points on the daily chart and using it for shorter term positioning on the daily charts. Pivot points can also be calculated using the monthly pivot points on the daily chart, and used for longer-term positions.
There are several methods used to determine the Pivot Point. We have included the three different formulas in Track 'n Trade 5.0.
Traditional formulas:
Pivot Point = (H + L + C)/3
First Support Line = (2 x Pivot Point) - H
First Resistance Line = (2 x Pivot Point) - L
Second Support Line = Pivot Point - (H - L)
Second Resistance Line = Pivot + (H - L)
Third Support Line = Low - 2*(High - Pivot)
Third Resistance Line = High + 2*(Pivot - Low)
Variation 1:
This method changes the formula used to derive the Pivot Point. The changes include adding the trading day's open and calculating the average of the four values. With this variation, one takes into account both opening gaps and overnight trading. The calculation is here:
Pivot Point = (H* + L* + C* + O**) / 4
*=Yesterday
**=Today
Variation 2:
This method changes the formula used to derive the Pivot Point as well. In this method you substitute yesterday's close with today's open. Variation 2 also takes into account opening gaps and overnight trading. The calculation is here:
Pivot Point = (H* + L* + O**) / 3
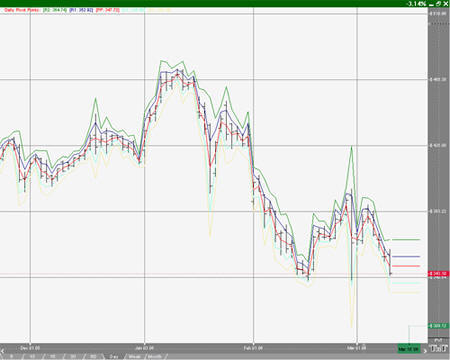
Open the Preference tab from the Control Panel on the left of your screen. Select the Pivot Points on your screen. The preferences will appear in the Control Panel. (Once you click on the chart, the Preference tab will go back to chart settings.)
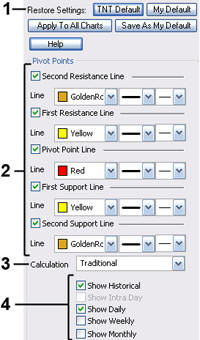 1. Restore Settings: TNT Default will change your settings back to the original software settings. My Default will change current settings to your personalized default settings. Apply To All Charts will apply your selected settings on all open charts. Save As My Default will save your current personal settings.
2. Pivot Points: Check the boxes to view different support and resistance lines. Change the color, style, and thickness of the lines.
3. Calculation: Select Traditional, Variation 1, or Variation 2.
4. Display Settings: Check to display Historical, Daily, Weekly, or Monthly pivot points. Select if you would like to see the Moving average line and enter the number of price bars you would like to be used to calculate it.
This system uses two simple moving averages, but they are calculated in a slightly different manner than those traditionally used. The first moving average is a moving average of the daily highs, as opposed to that of the daily settlement. The second moving average is calculated using the daily lows.
Though Mr. Bernstein recommends using a 10 period moving average of the daily highs and an 8 period moving average of the daily lows based on his observation that prices tend to fall about 20% faster than they rise, any combination would do the trick. Generally, accepting market lore that prices fall faster than they rise, the moving average of the lows should be of shorter term duration than that of the highs.
The most basic use of the 10x8 Moving Average is to look for a breakout above the upper moving average to initiate a buy signal. When the daily settlement price exceeds the average high of the last 10 days, this indicator flashes a buy signal indicating that the trend of the market should be up.
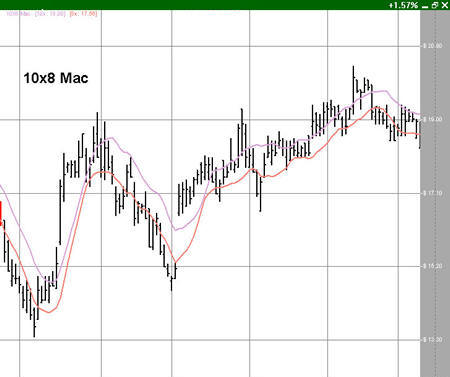
Open the Preference tab from the Control Panel on the left of your screen. Select the 10x8 MAC line on your screen. The preferences will appear in the Control Panel. (Once you click on the chart, the Preference tab will go back to chart settings.)
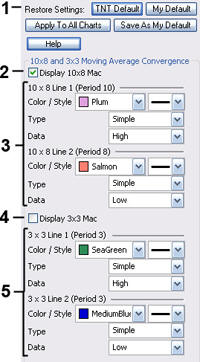 1. Restore Settings: TNT Default will change your settings back to the original software settings. My Default will change current settings to your personalized default settings. Apply To All Charts will apply your selected settings on all open charts. Save As My Default will save your current personal settings.
2. Display: Check the box to display the 10x8 MAC lines 1 and 2
3. 10x8 MAC Line: Change the color and style of the line. Also, change the type of the line from Simple, Linear Weight, or Extra Smoothed. Change the Data from Open, High, Low, or Close.
4. Display: Check the box to display the 3x3 MAC line.
5. 3x3 MAC Line: Change the color and style of the line. Also, change the type of the line from Simple, Linear Weight, or Extra Smoothed. Change the Data from Open, High, Low, or Close.
Volume By Price is an overlay that shows the amount of volume for a certain price range. It is shown by horizontal bars based on the current data of the chart. The drawn bars span the price range, meaning that all volumes within that range are added to that bar. Chartists can use Volume By Price to provide support or resistance based on the high volume price ranges.
Volume By Price can be used as a support and resistance identifier. That is because larger volume at a certain price range shows higher interest in that price range. This interest can influence future supply and demand such that if the price goes to far away from the interest range then the price is likely to return to that range. Therefore, if an arrow is thrown by another indicator and the arrow is near a peak or valley in a low interest (low Volume By Price area) and the arrow points toward the higher interest price range then it can be said that the arrow is more likely accurate or supported.
Example of Volume By Price overlay with the Volume indicator:
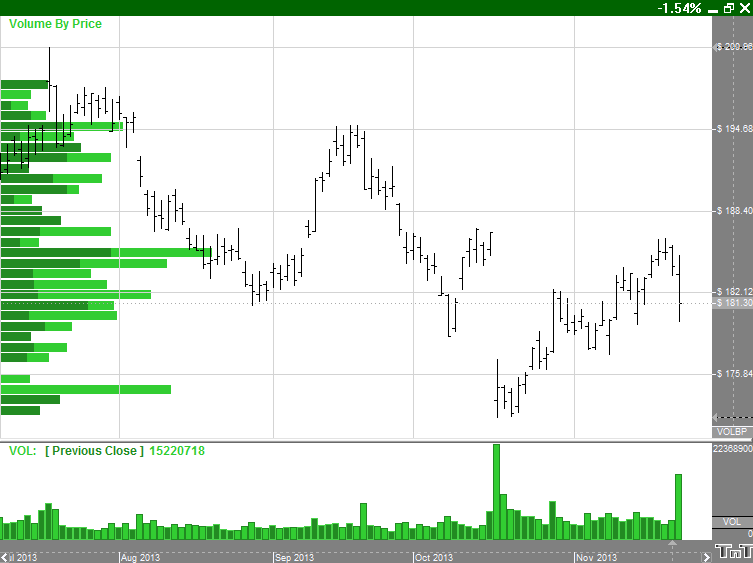
Calculation
Volume By Price calculations are based on the current chart screen and the price bar being displayed. That means that if the price bar is on the screen then it's volume is taken into account and if the price bar is not on the screen then it's volume is not taken into account. Know also that to be taken into account the close price for the price bar needs to be on the screen. The current chart screen is divided by the number of bars to get the price ranges for the Volume By Price bars.
A Volume By Price bar is broken up into down volume (darker default color) and up volume (lighter default color). Up volume is when a price bar's price is greater than the open and down volume is when a price bar's close is less than the open.
Preferences
Right-click anywhere on the chart and go to "Overlay Properties." Select Volume By Price from the list. The preferences will appear in the Control Panel. (Once you click on the chart, the Preference tab will go back to chart settings.)
Restore Settings: TNT Default will change your settings back to the original software settings. My Default will change current settings to your personalized default settings. Apply To All Charts will apply your selected settings on all open charts. Save As My Default will save your current personal settings.
1. Volume Up: This is the color of the up volume or the volume for which the close price is above the open price.
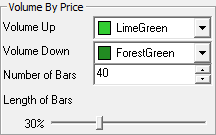 2. Volume Down: This is the color of the down volume or the volume for which the close price is lower than the open price.
3. Number of Bars: This option specifies the number of bars that is being drawn on the screen. The number of bars is used the in the calculation for the ranges of the Volume By Price bars.
4. Length of Bars: The length of the Volume By Price bars is the percent of the chart.
The Zig Zag Indicator acknowledges minimum price changes and ignores those that do not fit the criteria.
A Zig Zag set at 10% with OHLC bars would yield a line that only reverses after a change from high to low of 10% or greater. All movements less than 10% would be ignored. The value at the 10% is called the target of Zig Zag. If a commodity traded from a low of 100 to a high of 109, the Zig Zag would not draw a line because the move was less than 10%. If the stock advanced from a low of 100 to a high of 110, then the Zig Zag would draw a line from 100 to 110 because the target was reached. If the commodity continued on to a high of 112, this line would be extended to 112 (100 to 112). The Zig Zag would not reverse until the commodity declined 10% or more from its high. From a high of 112, a commodity would have to decline 11.2 points (or to a low of 100.8 the new target) for the Zig Zag to reverse and display another line.
Retracements are from zig zag high to high, or zig zag low to low. If Zig Zag retraces to a zig zag High, they are calculated from the movement from the previous zig zag low to the current high divided by the movement from the previous zig zag high to the previous low.
The Zig Zag indicator arrows are thrown when the market hits the target value. That means that a buy signal occurs when a valley is found by the market rising above the target value. That also means that a sell signal occurs when a peak is found by the market falling below the target value. In the example given that means the buy signal happened at 110 and the sell signal would happen at 100.8 if the market declined.
Zig Zag Example:
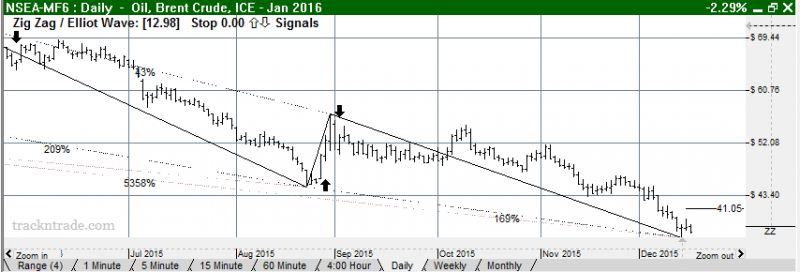
Open the Preference tab from the Control Panel on the left of your screen. Select the Zig Zag line on your screen. The preferences will appear in the Control Panel. (Once you click on the chart, the Preference tab will go back to chart settings.)
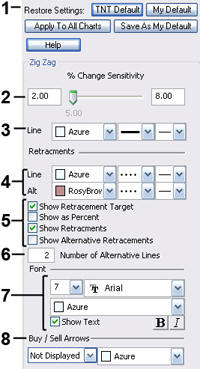 1. Restore Settings: TNT Default will change your settings back to the original software settings. My Default will change current settings to your personalized default settings. Apply To All Charts will apply your selected settings on all open charts. Save As My Default will save your current personal settings.
2. % Change Sensitivity: Change the percent of calculation.
3. Line: Choose the color, line style, and line thickness of your indicator line.
4. Line, Alt: Choose the color, line style, and line thickness of the retracement lines.
5. Show Retracement Target / Show as Percent, / Show Retracements / Show Alternative Retracements: to show percents, retracements, and alternative retracements.
6. Number of Alternative Lines: Enter the amount of alternative retracement lines you want to show on the chart.
7. Font: Select the font, size, and color of the text. You can also choose to bold or italicize.
8. Buy/Sell Arrows: Turns the display for buy/sell arrows on and off. You also have the option to change the color of the buy/sell arrows.
Indicators are displayed in a window below the Chart Window, referred to as the Indicator Window. Here in the manual the indicator titles are as listed in the right click menu, "Quick Link - name".

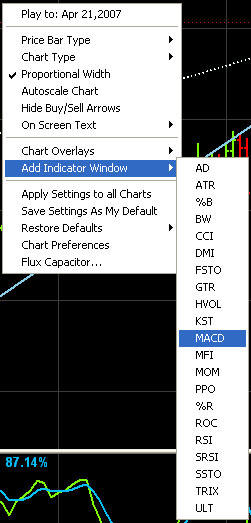 Displaying Indicators
To display an Indicator, right-click in the Chart Window or Indicator Window then choose the indicator from the menu. Mouse over Add Indicator Window and a list of indicators will appear. Select the indicator you want opened. You can open ten Indicator Windows at once on one chart, and you can have up to four indicators in each window. When you open a fifth indicator the last indicator opened will automatically be closed.
To open an additional indicator within the indicator window, right-click and choose the indicator from the menu. The indicators that are currently open will have a check mark by them. To remove an indicator from your chart, simply right click in the indicator window again.
On Screen Text
When you open an indicator, an overlay indicator or an indicator in the indicator window, you will see text appear on your chart in the upper left hand corner. You can choose whether to show this text, and choose where it appears by right-clicking on your chart. Mouse over On Screen Text to view your options. This will also change the on screen text of your overlays too.
Right-click the indicator quick link to toggle between other indicators, change indicator preferences, or to remove the indicator window from your chart. The indicator quick links may be used to determine which indicator appears in front of the window. You may change the order by selecting the lower indicator quick link line followed by a quick drag and drop of the link above other listed quick links.
In this example, moving the MACD quick link above the KST quick link will display the MACD indicator window in front of the KST indicator:
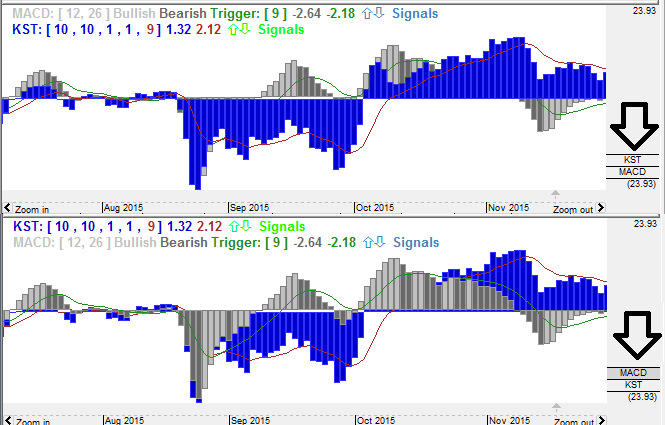
The main thing to look for is a difference between the AD and the market trend. If a market were to make a matching or lower low, or a matching or higher high and the AD fails to follow the market trend, this is divergence. Divergence implies that a reversal in the dominant trend may be near.
A series of lower lows would read as a decreasing AD. The pattern created by the AD and the differences in the chart are what the trader looks for. Divergence, or a difference from the pattern, is what you want to see. For example, if the market continues to march to higher territory and the AD follows by doing the same, then there is no divergence. However, if the market makes several new highs but the AD fails to make new highs, it is a warning signal of a market about to reverse direction.
The AD index is computed several different ways. Some computations normalize the index, while others add extra smoothing factors through the use of moving averages.
The first comparison checks for accumulation. (Is the current close higher than the previous close?) If the market is accumulating, subtract the difference between current close and low. Add the difference to the Accumulation/Distribution Index. Traders perceive an undervalued market and they buy.
If Closet > Closet-1 then ADt = ADt-1 + (Closet - Lowt)
The second comparison checks for no change in price. If correct, the AD index does not change.
If Closet = Closet-1 then ADt = ADt-1
The last and final comparison checks for a down market. It looks for the current close below previous close. If it’s correct, the market is distributing. The software first computes the difference between current high and close. Then it subtracts that difference from the AD index. This measures market distribution. Traders perceive an overvalued market and are selling.
If Closet < Closet-1 then ADt = ADt-1 - (Hight - Closet)
ADt: The accumulation/distribution index for the current period.
ADt-1: The accumulation/distribution index for the previous period.
Closet: The closing price for the current interval.
Closet-1: The closing price for the previous interval.
Hight: The true high price for the current interval (current high or previous close).
Lowt: The true low price for the current interval (current low or previous close).
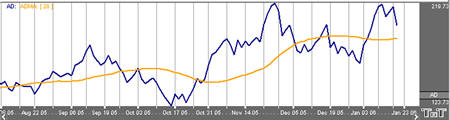
Open the Preferences Tab in your Control Panel. Select the AD quick link at the right of the indicator window. (Once you click on the chart, the Preference tab will go back to chart settings.)
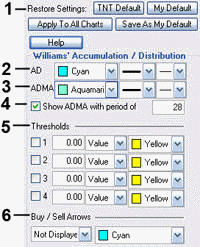 1. Restore Settings: TNT Default will change your settings back to the original software settings. My Default will change current settings to your personalized default settings. Apply To All Charts will apply your selected settings on all open charts. Save As My Default will save your current personal settings.
2. AD: Change the color, line style, and line thickness of the Accumulation and Distribution line in the Indicator Window.
3. ADMA: Change the color, line style, and line thickness of the Accumulation/Distribution Moving Average line in the Indicator Window.
4. Show ADMA: Uncheck this box to hide the ADMA line. When the box is checked, specify the number of days used in calculating the ADMA Indicator. The default number is 28 days.
5. Thresholds: Gives you the option of displaying four threshold lines, which can be displayed as a value or a percentage in the Indicator Window. You also have the option to change the color of the threshold line.
6. Buy/Sell Arrows: You have the option to display buy/sell arrows on your chart according to the indicator. Click the arrow to view Displayed or Not Displayed. You also have the option to change the color of the buy/sell arrows.
The Average True Range Indicator was developed by Welles Wilder to work with the commodity industry. The purpose of the ATR is to recognize the level of volatility in a market.
Volatility is a measurement of the change in price over a given period. It is often expressed as a percentage and computed as the annualized standard deviation of the percentage change in daily price.
When a market is going sideways, it typically exhibits low volatility and is difficult to trade. A market with higher volatility is typically trending better which would produce more opportunities to get into a trade. If a market’s volatility is too high, traders find that the market is too erratic, and it becomes difficult to trade. In using the ATR, traders hope to measure the level of volatility to help them interpret the different markets they are watching. It is important to remember to consult other indicators or analysis so that you are not relying on only one indicator to determine market entry or exit.
The ATR’s value is a measurement of the market volatility. When a market is increasing in volatility the ATR will have a higher value, and when the market is decreasing in volatility the ATR will have a lower value.
The ATR is a moving average of the True Ranges defined below. The default period interval in Track ‘n Trade Live is 5 days. The ATR is calculated based on the largest of the three distances from the following:
Today’s HIGH to today’s LOW
Yesterday’s CLOSE to today’s HIGH
Yesterday’s CLOSE to today’s LOW
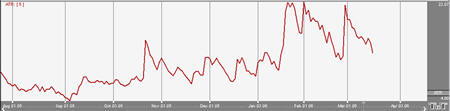
Open the Preferences Tab in your Control Panel. Select the ATR quick link at the right of the indicator window. (Once you click on the chart, the Preference tab will go back to chart settings.)
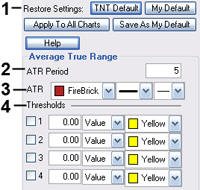 1. Restore Settings: TNT Default will change your settings back to the original software settings. My Default will change current settings to your personalized default settings. Apply To All Charts will apply your selected settings on all open charts. Save As My Default will save your current personal settings.
2. Period: Specify the number of days to be used in calculating the ATR.
3. Line: Choose the color, line style, and line thickness of your line.
4. Thresholds: Gives you the option of displaying four threshold lines, which can be displayed as a value or a percentage in the Indicator Window. You also have the option to change the color of the threshold line.
You can also use the indicator by looking for divergence between the indicator and the charts. Sharp price advances and declines usually accompany market tops and bottoms, and as a market climbs or falls toward a bottom, the indicator will tend to initially follow the price trend and then fall off, leading to bullish or bearish divergences with the chart.
A buy signal occurs when %B value crosses from below the 0 line to above the 0 line. A sell signal occurs when %B value crosses from above the 0 line to below the 0 line.
Example of Percent Bollinger Bands
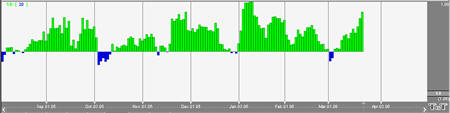
Open the Preferences Tab in your Control Panel. Select the %B quick link at the right of the indicator window. (Once you click on the chart, the Preference tab will go back to chart settings.)
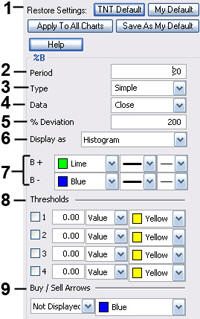 1. Restore Settings: TNT Default will change your settings back to the original software settings. My Default will change current settings to your personalized default settings. Apply To All Charts will apply your selected settings on all open charts. Save As My Default will save your current personal settings.
2. Period: Specify the number of days to be used in calculating the %B.
3. % Deviation: Define the displacement between the bands.
4. Type: Choose from Simple, Linear Weight, or Exponential.
5. Data: Choose from Open, High, Low, or Close.
6. Display as: Choose to view as a Histogram or Line.
7. B+/B-: Choose the color, line style, and line thickness of your line.
8. Thresholds: Gives you the option of displaying four threshold lines, which can be displayed as a value or a percentage in the Indicator Window. You also have the option to change the color of the threshold line.
9. Buy/Sell Arrows: Turns the display for buy/sell arrows on and off. You also have the option to change the color of the buy/sell arrows.
During a period of rising price volatility, the distance between the two bands will widen (BB Width will increase). Conversely, during a period of low market volatility, the distance between the two bands will contract (BW will decrease).
The tendency is for the bands to alternate between expansion and contraction. When the bands are unusually far apart, it is often a sign that the current trend may be ending. When the distance between the two bands has narrowed, it is often a sign that a market may be about to begin a new trend.
The BW gives an indication of how wide the Bollinger Bands are as a function of the middle band. It is used to identify the squeeze at low values and the end of trends at high values.
The calculation of the BW is here:
Bollinger Bandwidth = [Top Bollinger Band (x periods)] - [Bottom Bollinger Band (x periods)] / Simple Moving Average Close (x periods)
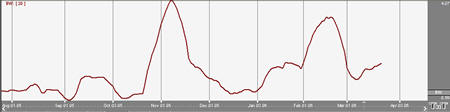
Open the Preferences Tab in your Control Panel. Select the BW quick link at the right of the indicator window. (Once you click on the chart, the Preference tab will go back to chart settings.)
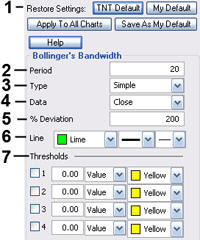 1. Restore Settings: TNT Default will change your settings back to the original software settings. My Default will change current settings to your personalized default settings. Apply To All Charts will apply your selected settings on all open charts. Save As My Default will save your current personal settings.
2. Period: Specify the number of days to be used in calculating the BW.
3. % Deviation: Define the displacement between the bands.
4. Type: Choose from Simple, Linear Weight, or Exponential.
5. Data: Choose from either Open, High, Low, or Close.
6. Line: Choose the color, line style, and line thickness of your line.
7. Thresholds: Gives you the option of displaying four threshold lines, which can be displayed as a value or a percentage in the Indicator Window. You also have the option to change the color of the threshold line.
Donald Lambert, the creator of this indicator, says that 70% to 80% of all price fluctuations fall within +100 and -100 as measured by the index. The calculation for CCI measures the average daily price’s distance from a moving average of average daily prices.
There are basic trading rules for the CCI: buy when the CCI exceeds -100 and sell when the CCI drops below +100. In other words, a buy signal is generated when the indicator enters the channel, or exceeds -100, coming up from the bottom. A sell signal is generated when the indicator enters the channel from the top, or drops below +100.
Followers of the CCI generally look to establish long positions when the CCI exceeds the -100 level, indicating that prices are in a strong up trend. Most users of this indicator also try to look for patterns within the indicator, such as higher highs, and look for CCI movements to be confirmed by general price readings as well.
The purpose of the CCI index is to keep you out of the market during consolidation, or weak trending periods. By measuring the difference between average prices and mean average prices, this indicator attempts to isolate only strongly trending markets, similar to momentum and MACD.
When CCI is viewed in the Indicator window of Track ‘n Trade Live, -100 is 33% of the window and +100 is 66% of the window. Guides could be set at these two points for ease in tracking CCI. You could also say that -85 would be roughly 36% and +85 would be roughly 64% of the window.
The proper calculation of the CCI requires several steps in the proper sequence. You must first compute the typical price using the high, low, and close for the interval. Simply, take the average of the three values.
TP = (Hight + Lowt + Closet) / 3
TPt: Represents the typical price.
Hight: The highest price for this interval.
Lowt: The lowest price for this interval.
Closet: The closing price for this interval.
Next, calculate a simple moving average of the typical price for the number of periods specified.
TPAVGt = (TP1 + TP2 +... + TPn) / n
TPAVGt: The moving average of the typical price.
TPn: The typical price for the nth interval.
N: Number of intervals for the average.
Compute the mean deviation.
MDt = (|TPAVG1 - TP1| + ... + |TPAVG1 - TPn |) / n
MDT: The mean deviation for this interval.
TPn: The typical price for the nth interval.
N: Number of intervals.
Note: The symbol | | designates absolute value. Negative differences as well as positive differences are treated as positive values.
Final Computation:
CCIt = (TPt - TPAVGt) / (.015 x MDT)
CCIt: The Commodity Channel Index for the current period.
TPt: The typical price for the current period.
TPAVGt: The moving average of the typical price.
.015: A constant.
MDT: The mean deviation for this period.
For a line drawing, a buy signal occurs when the CCI line crosses from below the lower threshold to above the lower threshold. A sell signal occurs when the CCI line crosses from above the upper threshold to below the upper threshold.
For a histogram drawing, a buy signal occurs when the CCI value crosses from below the 0 line to above the 0 line. A sell signal occurs when the CCI value crosses from above the 0 line to below the 0 line.
Example of Commodity Channel Index
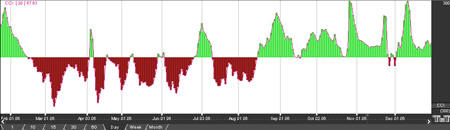
Open the Preferences Tab in your Control Panel. Select the CCI quick link at the right of the indicator window. (Once you click on the chart, the Preference tab will go back to chart settings.)
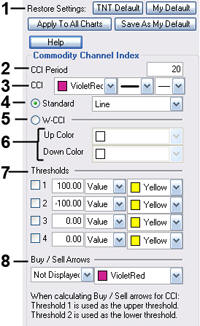 1. Restore Settings: TNT Default will change your settings back to the original software settings. My Default will change current settings to your personalized default settings. Apply To All Charts will apply your selected settings on all open charts. Save As My Default will save your current personal settings.
2. CCI Period: To specify the number of days used in calculating CCI, simply click in the box, highlight the current number, and type in a new value.
3. CCI: Change the color, line style, and line thickness of the CCI.
4. Display as: The CCI can be displayed as a line or a histogram.
5. WCCI Option: When you select the WCCI (Woodies CCI) option in the CCI preferences tab this will apply a histogram divided in the middle. See the WCCI example below.
6. WCCI Colors: These two color options allow you to select the color of the histogram above and below (up or down colors) the zero line.
7. Thresholds: The Upper Threshold and Lower Threshold are automatically displayed in the Indicator Window. The crossing of the CCI line below the Upper threshold is a sell signal. The crossing of the CCI above the Lower threshold is a buy signal. You also have the option to view the threshold as a percent or a value, and change the color of the threshold lines.
8. Buy/Sell Arrows: You have the option to display buy/sell arrows on your chart according to the indicator. Click the arrow to view Displayed or Not Displayed. You also have the option to change the color of the buy/sell arrows.
By comparing the close to the high and low, the CMF is determining if the market has pressure to sell or buy. In doing this, the CMF is giving an indication of overbought and oversold by using these comparisons. If the market is consistently closing in the top region of the price bar and there is an increase in volume (showing an increase in the number of trades) then CMF exhibits a positive value. If the market is consistently closing in the bottom region of the price bar and there’s an increase in volume, CMF exhibits a negative value.
When the CMF indicator crosses the zero line either up or down, this is an indication of a change in trend. Traders use this indicator to help confirm breakout signals from either support or resistance trend lines.
The calculation of the CMF is here:
CMF = SUM(MFM, n) / SUM(VOL, n)
where n = Period
MFM = VOL x [(close - low) - (high - close)] / (high - low)
MFM stands for Money Flow Multipliplier
A buy signal occurs when the CMF value crosses from below the 0 line to above the 0 line. A sell signal occurs when the CMF value crosses from above the 0 line to below the 0 line.
Example of Chaikin Money Flow
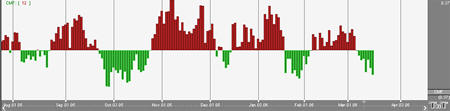
Right-click on the CMF button in your Indicator toolbar and select CMF Settings. The Preferences Tab will open in the Control Panel and the CMF preferences will be displayed. (Once you click on the chart, the Preference tab will go back to chart settings.)
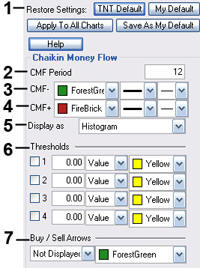 1. Restore Settings: TNT Default will change your settings back to the original software settings. My Default will change current settings to your personalized default settings. Apply To All Charts will apply your selected settings on all open charts. Save As My Default will save your current personal settings.
2. CMF Period: Specify the number of days to be used in calculating the CMF.
3. CMF+: Change the color, style, and thickness of your line.
4. CMF-: Change the color, style, and thickness of your line.
5. Display as: Choose between displaying CMF as a histogram or a line.
6. Thresholds: Gives you the option of displaying four threshold lines, which can be displayed as a value or a percentage in the Indicator Window. You also have the option to change the color of the threshold line.
7. Buy/Sell Arrows: Turns the display for buy/sell arrows on and off. You also have the option to change the color of the buy/sell arrows.
Directional Moving Index is plotted as three lines on a scale of 0 to 100. This scale is a measure of market trend. The two lines of DMI show the amount of positive and negative movement. The positive line is called D+ and the negative D-. The direction of these lines and the use of crossovers can show the changes in the current market. The key to this indicator is the ADX, or average of the difference of these two lines. The ADX is the main factor in using this indicator. During periods of extreme price variation the two lines can become very volatile, and the ADX is used to compensate for this.
The best application of DMI is present when used with another indicator. DMI should either confirm or contradict the indicator being used. It is also best to use DMI in long-term trade situations. Because the study is not as sensitive as other indicators it is appropriate to use it as a confirmation tool. When the DMI is advancing, the average is higher on the 0 to 100 scale, trend following systems are best employed. Likewise, with a decreasing DMI average, the line is lower on the scale, closer to 0, so a counter trend system might be best. These traits represent the fact that as the average line goes higher in the scale the strength of the trend is gaining, and as the ADX goes lower the trend is losing strength. It is also important to look at the individual lines for changes in price movement.
The other application for DMI is to look at the D+ and D- lines themselves. When the D+ line crosses above the D- line a buy signal is initiated. This indicates that the positive price direction is greater than the negative. Conversely, once the D+ line crosses below the D- line, a sell trigger is present. The negative price movement is overtaking the positive.
Welles Wilder himself said that he was not comfortable using these two lines by themselves. When looking at reversals, the ADX should be above both lines, and once it turns lower we should see a change in market direction. You should also look to ADX for confirmation.
This application is much the same as momentum, showing a change in the market sentiment. Wilder also says that a trend following system should not be used when the ADX line is below both D lines, as this means that the market has no discernible direction.
When using the D+ and D- crossover method, Wilder stresses the use of an extreme point. On the day the crossover occurs, the extreme point is the high or low of the day (high for a buy, and low for a sell). The market should be able to take out that price and stay beyond it for several days before the trade is initiated or exited. This use of extreme points should keep the trader from getting into whipsaws or false breakouts.
The computations needed to generate the final figures for the DMI are not complex but are numerous and lengthy. The following discussion attempts to unravel the computational mysteries of the DMI. If you need further explanation, please refer to the author’s original work. The book titled New Concepts in Technical Trading Systems by J. Welles Wilder, Jr., explains this indicator and several others.
You must first compute the directional movement, DM, for the current trading interval. Directional movement can be up, down, or zero. If directional movement is up, it is labeled as +DM, and -DM refers to downward directional movement. Wilder defines directional movement as the largest part of the current trading range that is outside the previous trading range. From a mathematical view, it is the largest value between two equations:
Hight - Hight-1 or Lowt - Lowt-1
This is only true when the current low is less than the previous low, or the current high exceeds the previous high. Both of these conditions do not have to be met, only one. It is the largest portion of the trading range outside of the previous trading range.
It is possible for the directional movement to be zero. This occurs when the current trading range is inside the previous trading range, or when the trading ranges, current versus previous, are equal.
Directional movement is up, or positive, when the difference between the highs is the greatest. It is down, or negative, when the difference between the lows is the largest value. The up directional movement is +DM and down directional movement is -DM. Do not let the plus and minus sign designation mislead you. They only indicate upward or downward movement, not values. The directional movement value is always a positive number, or absolute value, regardless of upward or downward movement. This concept is crucial to understanding the computations for the indicator. If you are confused, draw some illustrations or work with actual price data to determine the directional movement values.
The next step in determining the DMI is to compute the true range. The true range (TR) is always a positive number. According to the Wilder, the true range is the largest value of three equations:
Hight - Lowt
Hight - Closet-1
Lowt - Closet-1
Continue this process for the specified trading interval. In this example, use a value of 14. This is the same value Wilder used on daily data. His logic for using this value is that it represents an average half-cycle period. When this task is accomplished for the specified interval, you compute the average value of the +DM, -DM, and TR. Wilder prefers to use an accumulation technique rather than computing a pure moving average. It is a short cut designed to save computational time and effort:
Averaget = (Averaget-1 - (Averaget-1 / n)) + Valuet
When you substitute the above symbols, you these equations:
+DMt = (+DMt-1 - (+DMt-1 / n)) + (+DMt)
-DMt = (-DMt-1 - (-DMt-1 / n)) + (-DMt)
TRt = (TRt-1 - (TRt-1 / n)) + (TRt)
It is a timesaving convention. This indicator was developed before microcomputers were invented. The only tool available was the desktop calculator or adding machine. You could spend a great deal of time and effort calculating averages.
You now have the average values. The next step is to compute the directional indicator. It can be either up or down, depending upon the directional movement. On up intervals use this calculation:
+DI = (+DM / TR) x 100
On a down interval use this formula:
-DI = (-DM / TR) x 100
The plus and minus directional indicator values are computed as percentage figures. You are expressing the percentage of the average true range for both up and down trading intervals.
If you have followed this process so far, the last few steps are relatively simple. You compute the difference between the +DI and the -DI. Remember to use the absolute value of this difference (Convert any negative value into a positive number).
DIdiff = | ((+DI) - (-DI)) |
Compute the sum of the directional indicator values using this formula:
DIsum = ((+DI) + (-DI))
Once you compute the DIdiff and the DIsum, you can calculate the DX or directional movement index. This value is always a percentage:
DX = (DIdiff / DIsum) x 100
The DX is always a value between 0 and 100. If your calculations exceed this range, you have made an error. Wilder was not comfortable using just the directional movement index. It could become very volatile during periods of extreme price movement, especially markets that rise and fall quickly. He implements his accumulated moving average technique to smooth the DX. The result is the ADX or average directional movement index. This is the computational procedure:
ADXt = ( (ADXt-1 x (n - 1) ) + DXt) / n
A buy signal occurs when the DMI+ line crosses from below the DMI- line to above the DMI- line. A sell signal occurs when the DMI+ line crosses from above the DMI- line to below the DMI- line.
Example of Directional Movement Index
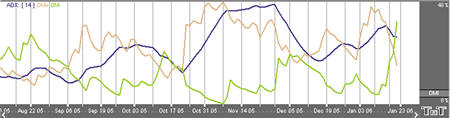
Extreme Point Validation: This filter delays the buy/sell arrows at least a day by requiring that the market move higher or lower than the high or low on the day the DM+,DM- crossover happened. If a new high or low is not obtained before the next DM+,- crossover, the buy/sell arrow is suppressed completely for that previous period. The filter does not require the use of DX/ADX, although it does stack with the other filers if they are used.
Trend Strength: The DX or ADX line must be above the target number before a DM+,- cross will give a buy/sell arrow. The theory is the DX/ADX lines indicate trend strength (not direction) and if it is below 20 there is practically no trend. Values above 40 indicate a strong trend. Different articles would use values between 20 and 40 as targets to look for. This box must be selected for this rule to be available.
Turning Point Validation: The directional index line (DX or ADX) must be above the point where DM+,- crossed. This is like a variable trend strength filter. The directional index can indicate any trend strengths as long as the trend strength is greater than the value of the DM+,- crossing point. This indicator also requires that the directional index line be on.
Open the Preferences Tab in your Control Panel. Select the DMI quick link at the right of the indicator window. (Once you click on the chart, the Preference tab will go back to chart settings.)
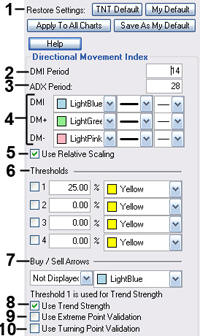 1. Restore Settings: TNT Default will change your settings back to the original software settings. My Default will change current settings to your personalized default settings. Apply To All Charts will apply your selected settings on all open charts. Save As My Default will save your current personal settings.
2. DMI Period: To specify the number of days used in calculating DMI, click in the box, highlight the current number, and type in a new value.
3. Directional Indicator: The two methods available in displaying the DMI indicator are Averaged Directional Index (ADX) and the Directional Index (DX). Click on the button in front of the method to select.
4. DMI/DM+/DM: Change the color, line style, and line thickness of the DMI.
5. Use Relative Scaling: When selected, the 100% location is changed to the highest point value in the DMI indicator.
6. Thresholds: Gives you the option of displaying four threshold lines, which are displayed as a percentage of the Indicator Window. You also have the option to change the color of the threshold line.
7. Buy/Sell Arrows: You have the option to display buy/sell arrows on your chart according to the indicator. Click the arrow to view Displayed or Not Displayed. You also have the option to change the color of the buy/sell arrows.
8. Use Trend Strength: The DX or ADX line must be above the target number before a DM+/- cross will give a buy/sell arrow. The theory is the DX/ADX lines indicate trend strength (not direction) and if it is below 20 there is practically no trend. Values above 40 indicate a strong trend. Different articles would use values between 20 and 40 as targets to look for. This box must be selected for this rule to be available.
9. Use Extreme Point Validation: This filter delays the buy/sell arrows at least a day by requiring that the market move higher or lower than the high or low on the day the DM+/DM- crossover happened. If a new high or lower low is not obtained before the next DM+/- crossover, the buy/sell arrow is suppressed completely for that previous period. The filter does not require the use of DX/ADX, although it does stack with the other filters if they are used.
10. Use Turning Point Validation: The directional index line (DX or ADX) must be above the point where DM+/- crossed. This is like a variable trend strength filter. The directional index can indicate any trend strengths as long as the trend strength is greater than the value of the DM+/- crossing point. This indicator also requires that the directional index line be on.
This indicator is designed to show conditions of overbought and oversold markets. Stochastics are divided into two types: Regular Stochastics, often referred to as Fast Stochastics, and Slow Stochastics. Fast Stochastics are more sensitive to price changes and can give a lot in the short-term, hence the need for Slow Stochastics.
Stochastics display two lines that move in a vertical scale between 0 and 100, representing percentiles from 0% to 100%. Think of the level of Stochastics as where the most current close is within a specific range. If Stochastics are reading 50%, the current close is in the middle of the price range for a specified period of time. If Stochastics are reading 100%, the close is at the high of the range, and 0% represents the current close price being at the low of the range. This will help you to understand why Stochastics are a counter trend indicator, in that the underlying principle behind Stochastics is that prices will move back to the center of the trading range, or the opposite extreme.
When both lines move to an area below 20 on this scale they are said to be in an oversold zone. Conversely, when both %K and %D move to above 80 on this same scale they are indicating an overbought zone. It is this indication of market sentiment that makes this counter trend indicator useful.
George Lane emphasized that the most important signal generated by this method was the difference or divergence between %D and the underlying market price. He said that the divergence is where %D line makes a group of lower highs while the market makes a series of higher highs. This would indicate an overbought condition. The reverse would be true of an oversold market, with %D making higher lows and prices making lower lows.
As with a dual moving average system, when the faster reacting indicator crosses the slower moving indicator, a buy or sell is signaled. Because Stochastics give an indication of either overbought or oversold, you would first want to see both lines in the above 80 or below 20 range, and sloping out of that range back to the middle before looking for these trade triggers.
The first step in computing the stochastic indicator is to determine the n period high and low. Suppose you specified twenty periods for the stochastic. Determine the highest high and lowest low during the last twenty trading intervals. It determines the trading range for that time period. The trading range changes on a continuous basis. The calculations for the %K is here:
%Kt = ( (Closet - Lown) / (Highn - Lown) ) x 100
%Kt: The value for the first %K for the current time period.
Closet: The closing price for the current period.
Lown: The lowest low during the n periods.
Highn: The highest high during the n time periods.
n: The value you specify.
Once you obtain the %K value, you start computing the %D value which is an accumulative moving average. Since the %D is a moving average of a moving average, it requires several trading intervals before the values are calculated properly. If you specify a 20 period stochastic, the software system requires 26 trading intervals before it can calculate valid %K and %D values. The formula for the %D is here:
%DT = ( (%DT-1 x 2) + %Kt) / 3
%DT: The value for %D in the current period.
%DT-1: The value for %D in the previous period.
%Kt: The value for %K in the current period.
The values 2 and 3 are constants. You specify the constants and the length of the time period to examine for the trading range.
A buy signal occurs when both lines are below the lower threshold and the %K line crosses from below the %D line to above the %D line. A sell signal occurs when both lines are above the upper threshold and the %K line crosses from above the %D line to below the %D line.
Example of Fast Stochastics
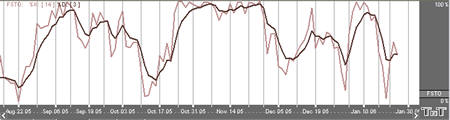
Open the Preferences Tab in your Control Panel. Select the FSTO quick link at the right of the indicator window. (Once you click on the chart, the Preference tab will go back to chart settings.)
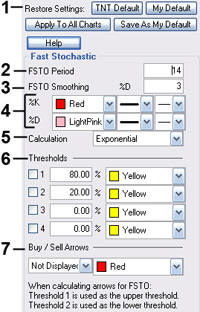 1. Restore Settings: TNT Default will change your settings back to the original software settings. My Default will change current settings to your personalized default settings. Apply To All Charts will apply your selected settings on all open charts. Save As My Default will save your current personal settings.
2. FSTO Period: To specify the number of days used in calculating the Fast Stochastics indicator, click in the box, highlight the number, and type in a new value.
3. FSTO Smoothing: To specify the number of days used in calculating smoothing, click in the box, highlight the number, then type in a new value.
4. %K/%D: Change the color, line style and line thickness of the %K and %D lines.
5. Calculation: Choose from Exponential, Simple, and Wilder’s Smoothing for the type of formula used to calculate the indicator.
6. Thresholds: You are given the option to view four threshold lines in the Indicator Window. The crossing of the %D line above the %K line is a sell signal and only confirmed if this crossing occurred above the Upper Threshold line. The crossing of the %D line below the %K line is a buy signal and only confirmed if this crossing occurred below the Lower Threshold line. You can also change the color of the threshold lines.
7. Buy/Sell Arrows: Select to display the buy/sell arrows. Click the arrow to view Displayed or Not Displayed. You also have the option to change the color of the buy/sell arrows.
The Gator was created on a relative scale; what seems to be a large move in the market today may well be just a small move on the historical scale, since the Gator graphically represents itself only against its own historical price line. As the market trends, the Gator will also trend, causing historical representations of market momentum and movement to pale in comparison.
Example of Gator Oscillator
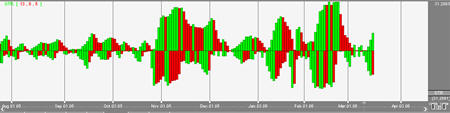
Open the Preferences Tab in your Control Panel. Select the GTR quick link at the right of the indicator window. (Once you click on the chart, the Preference tab will go back to chart settings.)
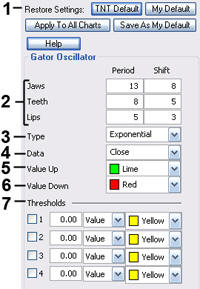 1. Restore Settings: TNT Default will change your settings back to the original software settings. My Default will change current settings to your personalized default settings. Apply To All Charts will apply your selected settings on all open charts. Save As My Default will save your current personal settings.
2. Jaws, Teeth, Lips: Specify your periods and shift specifications.
3. Type: Select Simple, Linear Weight, or Exponential.
4. Data: Choose the data you would like to be calculated.
5. Value Up: Select the color of the histogram when the value is up.
6. Value Down: Select the color of the histogram when the value is down.
7. Thresholds: Gives you the option of displaying four threshold lines, which can be displayed as a value or a percentage in the Indicator Window. You also have the option to change the color of the threshold line.
Changing the period of time the study observes allows the trader to fine tune options prices. If a market has been extremely volatile for the past 3 months, for example, near term options should be more expensive. If the market has been calm for an extended period of time, longer term options should be reasonable. In futures, we use it for observation. It tells us if prices are calming down or becoming more erratic.
The key to using historic volatility is determining the correct period of time for each market. The market you are looking at may show a history of volatility years ago, but has been relatively calm the last few months. Getting an idea of the markets behavior recently may be of no use to the trader that is looking at distant options.
For the futures trader, this tool is useful as a guide for order placement. Changing market volatility may indicate that it is time to move stops closer or farther away. If the trader is profitable with the trend and volatility is changing, it might be a time to move stops closer to protect profits. If a trader is trading against the trend, he might want to move stops further away to avoid getting bumped out prematurely.
Options traders could use this study to help them purchase profitable options. The basic idea is to buy options when volatility is decreasing to take advantage of a change in that volatility. Any rise in volatility will translate to an increase in option values. Look at options strategies that take advantage of low volatility, such as straddles or ratio spreads. When volatility is high, selling options would be better because any decrease in volatility will translate to a loss of option value. Option strategies that take advantage of a decrease in volatility are strangles and regular short option positions.
Obviously, historic volatility is only one component of option pricing. Any changes in the underlying futures market could negate the changes in option prices due to volatility. For example, if you were to buy a low volatility Put option and prices go higher, that option will lose value but not as quickly as a higher volatility option.
For the futures trader, the basic concept is to expect market changes during periods of increased volatility. George Soros, the trading legend, said “Short term volatility is greatest at a turn around and diminishes as a trend becomes established.”
This indicator is commonly viewed as very mean regressive. What this term means is that the historic volatility indicator tends to return to the opposite end of the spectrum and therefore return to an average. If volatility is great it will eventually cool off and return to that place. If volatility is low it will not stay quiet forever. What this means to traders is that a market that is erratic will sooner or later calm down and a market that is quiet will eventually get loud again.
The calculation for the historical volatility is rather involved. The number of periods per year vary depending on the type of price chart used for the study. The following table lists the number of periods for each type of chart:
|
Chart Type |
Trading Periods Per Year |
| Perpetual | 252 |
| Daily | 252 |
| Weekly | 52 |
| Monthly | 12 |
| Variable | Based on chart period (see below) |
| Tick | Not available for this study |
When using variable charts, you must first calculate the number of trading periods per year. To do this, you must determine the trading time of the selected commodity. The formula is as follows:
TP = (Tt / Pn) x 252
TP: The total number of trading periods per year.
Tt: The total trading time in a day.
Pn: The length of the period.
252: The number of weekdays per year.
Example: The S&P 500 trades from 8:30 a.m. to 3:15 p.m. That is a total trading time of 6 hours and 45 minutes. On a variable chart using 5 minute bars, the number of periods for the day is 81:
6 hours x 60 minutes = 360 minutes + 45 minutes
Total minutes of trading = 405 minutes
405 / 5 minute bars = 81 trading periods per day
Now that you have calculated the trading periods per day, you now must calculate the number of periods for the year. Since historical volatility considers every weekday of the year when calculating total periods for the year, the multiplier is 252:
TP = (405/5) x 252
TP = 81 x 252
TP = 20,412
Note: This formula applies only to historical volatility on a variable chart. It does not apply to other chart types.
Now that you have the total number of periods per year, continue with the calculation of the historical volatility, by calculating the natural logarithm of the price change for each price in the specified time span of n periods:
LOGSi = LOG(Pi / Pi-1)
LOG: The natural logarithm function.
Pi: The current price.
Pi-1: The previous price.
Now that you have the natural logarithms of the price changes, calculate the total natural logarithms for the time span you are reviewing:
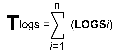
Tlogs: The total of the natural logarithm price ratio for the time span.
S: Indicates to sum all n natural logarithms.
LOGSi: The natural logarithm of the price change for period i.
N: The number of periods for the specified time span.
The next step is to calculate the average of the logs by dividing the total natural logarithm by the number of periods:
ALOGS = Tlogs / n
ALOGS: The average of the natural logarithms.
Tlogs: The total of the natural logarithm for the time span.
N: The number of periods for the specified time span.
The last calculation is to sum the squares of the difference between the individual natural logarithms for each period and the average natural logarithm:
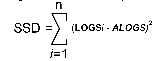
SSD: The sum of the squared differences.
S: Indicates to total the squares of all n differences.
LOGSi: The natural logarithm of the price change for period i.
ALOGS: The average of the natural logarithms.
Now that the elements of the final formula are complete, the following formula calculates the historical volatility for a given period over a specified time span:
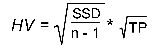
SSD: The sum of the squared differences.
n: The number of periods for the specified time span.
TP: The total number of trading periods for the year.
Due to the complexity of the formula, it is preferable to use a scientific calculator when attempting to manually calculate the historical volatility of a futures instrument.
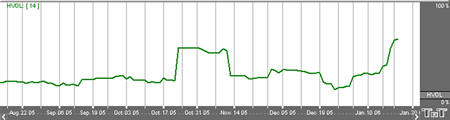
Open the Preferences Tab in your Control Panel. Select the HVOL quick link at the right of the indicator window. (Once you click on the chart, the Preference tab will go back to chart settings.)
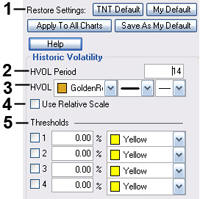 1. Restore Settings: TNT Default will change your settings back to the original software settings. My Default will change current settings to your personalized default settings. Apply To All Charts will apply your selected settings on all open charts. Save As My Default will save your current personal settings.
2. HVOL Period: To specify the number of days used in calculating Historic Volatility, simply click on the box, highlight the current number, and type in a new value.
3. HVOL: Change the color, line style, and line thickness of the HVOL.
4. Use Relative Scale: When choosing this option, the 100% location is changed to the highest point value in the HVOL indicator.
5. Thresholds: Gives you the option of displaying four threshold lines, which can be displayed as a value or a percentage in the Indicator Window. You also have the option to change the color of the threshold line.
Watch for bullish and bearish momentum signals in the KST indicator. When the KST turns upward, this is a bullish signal, and when the KST turns down, this is a bearish signal. More confirmation is given when the trigger line crosses the KST line as a result of the change in direction.
There are two lines: the trigger line and the KST line. The KST line is a result of the four moving averages smoothed as well as the Rate of Change or ROC. The trigger line is a moving average of the KST.
A buy signal occurs when the KST line is below the 0 line and crosses from below the trigger line to above the trigger line. A sell signal occurs when the KST line above the 0 line and crosses from above the trigger line to below the trigger line.
Example of Know Sure Thing
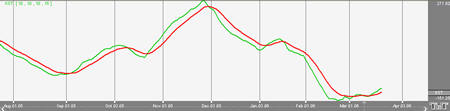
Open the Preferences Tab in your Control Panel. Select the KST quick link at the right of the indicator window. (Once you click on the chart, the Preference tab will go back to chart settings.)
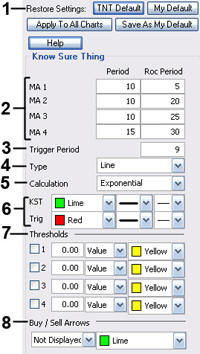 1. Restore Settings: TNT Default will change your settings back to the original software settings. My Default will change current settings to your personalized default settings. Apply To All Charts will apply your selected settings on all open charts. Save As My Default will save your current personal settings.
2. MA: Specify the number of days used in calculating the period and ROC period of the 1, 2, 3, and 4 moving average lines.
3. Trigger Period: Specify the number of days used in calculating the trigger period. Choose between a histogram or line.
4. Type: Choose if you would like to see KST as a histogram or line.
5. Calculation: Choose between Simple, Linear Weight, and Exponential.
6. KST/Trigger: Choose the color, line style, and line thickness of your KST and trigger lines.
7. Thresholds: Gives you the option of displaying four threshold lines, which can be displayed as a value or a percentage in the Indicator Window. You also have the option to change the color of the threshold line.
8. Buy/Sell Arrows: Turns the display for buy/sell arrows on and off. You also have the option to change the color of the buy/sell arrows.
MACD was created in an attempt to determine the strength of a trend along with the direction of that trend. Gerald Appel created a system that looked at two exponential moving averages and the difference between those two averages. Looking at these moving averages of the market we are able to see clear buy and sell signals. We are also able to get a more accurate signal by averaging the difference in the two moving averages.
Computing this indicator requires the use of exponential moving averages. Exponential moving averages are different than simple moving averages; instead of looking at only the last few days and averaging them, the exponential averages look at all the prices and puts more weight on the most recent data. This type of weighted average gives a smoother average price that reacts quickly to market moves. The two averages of MACD move above and below a base line, which gives indication of the strength of the current move. This placement of the two averages in relationship to the base line is calculated by looking at the exponential moving average of the difference between the two averages. Even though the two averages may cross, the divergence, or true indication of the signal, is not shown until both averages cross the base line.
Keeping this in mind, an ideal buy signal is seen on a move where the shorter-term average moves above the other average and both averages cross above the base line of zero. A sell signal would be the opposite of this.
The histogram method of MACD is read as a straight line above or below the zero base line. This line represents the difference between the Moving Averages. When the moving averages move above the base line they are indicating a buy, and as the difference between the averages increases the lines will get taller.
The opposite is true of a sell signal. Track ‘n Trade Live's ability to display MACD in this fashion is vital because it allows you to read the strength of the current trend along with the signal to buy or sell.
When MACD is plotted as a histogram, the values used to plot the histogram are the differences between the two moving averages on each day. The “trigger” line that appears on this chart is an average of the histogram data, or a smoothed view of the histogram.
Using the MACD as a histogram will allow the trader to spot divergences between the indicator and the market price. A divergence is present when the market makes a higher high than the previous high, but the MACD histogram fails to make a corresponding higher high. This is considered to be a sign of weakness and a sell signal when the MACD breaks below the lowest point in between the divergent highs.
Bullish divergence is seen in an exact opposite fashion. Assume a market has been trending downward. The market has been consistently making lower lows, as has been the MACD histogram indicator. However, eventually the MACD fails to make a lower low, corresponding to the lower low in price. If the MACD histogram line crosses above the highest high in between the divergent lows, then technical lore says higher prices should follow. You also have the choice to view the MACD indicator in a simple line style, instead of the histogram. In this view there is no trigger line. The line style MACD gives buy and sell signals based off of the crossing of the two moving averages.
In this study, the oscillator is the simple difference between the first two exponential moving averages:
OSCt = (EMA1 - EMA2)
OSCt: The oscillator for the current period.
EMA1: The first exponential moving average.
EMA2: The second exponential moving average.
The second part of the study computes an exponential moving average of the oscillator:
EMAosct = EMAosct-1+ (k x (OSCt - EMAosct-1))
EMAosct: The exponential moving average of the oscillator.
OSCt: The oscillator for the current interval.
EMAosct-1: The exponential moving average of the oscillator for the previous interval.
k: The exponential smoothing constant.
Since the second value, EMAosct, is an exponential moving average, it rises and falls slower than the oscillator, and the two lines generate crossover points. These crossover points are the buy/sell signals.
If the study is displayed as a histogram, each value for the lines is calculated:
DIFFt = OSCt - EMAosct
DIFFt: The difference between the oscillator for the current interval and the exponential moving average of the oscillator.
OSCt: The oscillator for the current interval.
EMAosct: The exponential moving average of the oscillator.
For a line drawing, a buy signal occurs when the MACD crosses from below the trigger line to above the trigger line, and the trigger line is less than 0. A sell signal occurs when the MACD line crosses from above the trigger line to below the trigger line, and the trigger line is greater than 0. We recommend you turn on the 0 Value threshold line to make sure your trigger line is above/below 0 in meeting the buy/sell signal conditions. A histogram drawing with the trigger line works similarly.
For a histogram drawing, a buy signal occurs when the MACD value crosses from below the 0 line to above the 0 line. A sell signal occurs when the MACD value crosses from above the 0 line to below the 0 line.
Example of Moving Average Convergence/Divergence
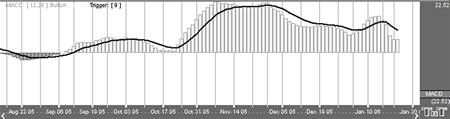
Open the Preferences Tab in your Control Panel. Select the MACD quick link at the right of the indicator window. (Once you click on the chart, the Preference tab will go back to chart settings.)
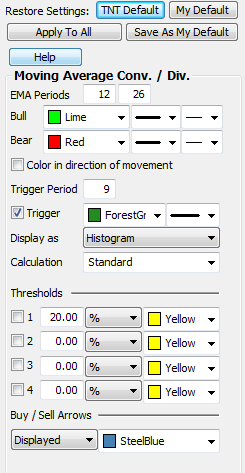 Restore Settings: TNT Default will change your settings back to the original software settings. My Default will change current settings to your personalized default settings. Apply To All Charts will apply your selected settings on all open charts. Save As My Default will save your current personal settings.
EMA Periods: The MACD is calculated using two exponential moving averages. To change the periods used in the formula, highlight the number and type in the new value desired.
Bull/Bear: Change the color, line style, and line thickness of the Bullish and Bearish lines.
Trigger Period: To change the number of days, click in the box, highlight the number, then type in the desired period.
Trigger: Check this box to hide the Trigger line. You can also change the color and line style of the Trigger.
6. Display as: The MACD indicator can be displayed differently. From the drop down menu, choose either to view it as a line or as a histogram.
Calculation: Choose how you would like your chart calculated. You can choose Standard Calculation or Extra Smoothing. Extra Smoothing is a proprietary formula developed by Lan H. Turner, president and CEO of Gecko Software, Inc. This method increases the movement in the MACD indicator and has shown to be more accurate (in Gecko Software’s market testing) than the standard calculation. Click the Extra Smoothing option to test its accuracy for yourself. Its relationship to the MACD is similar to the relationship between the Fast and Slow Stochastics - think of this indicator as the “Fast MACD.”
Thresholds: Gives you the option of displaying four threshold lines, which can be displayed as a value or a percentage in the Indicator Window. You also have the option to change the color of the threshold line.
Buy/Sell Arrows: You have the option to display buy/sell arrows on your chart according to the indicator. Click the arrow to view Displayed or Not Displayed. You also have the option to change the color of the buy/sell arrows.
The theory says that as money flows into the equity, or volume increases, the MFI will increase its rate of climb. As money flows out of the equity, volume decreases, and the MFI will decrease its rate of climb. The MFI is a classic overbought/oversold indicator based on a 0-100 scale. When the MFI reaches up above the top threshold, which is traditionally set at 75-80%, the equity is considered overbought and a retracement is anticipated. When the MFI line reaches below the 20-25% threshold, the underlying equity is considered oversold and a reversal is anticipated once again.
The "flow" of money is the product of price and vlume and shows the demand for a security and a certain price. The money flow is not the same as the Money Flow Index but rather is a component of calculating it. So when calculating the money flow, we first need to find the average price for a period. Since we are often looking at a 14-day period, we will calculate the typical price for a day and use that to create a 14-day average.
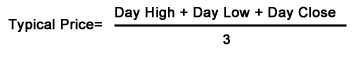
The calculation of MFI is here:
Money Flow = (Typical Price) x (Volume)
The MFI compares the ratio of "positive" money flow and "negative" money flow. If typical price today is greater than yesterday, it is considered positive money. For a 14-day average, the sum of all positive money for those 14 days is the positive money flow. The MFI is based on the ratio of positive/negative money flow (Money Ratio).
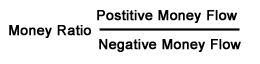
Finally, the MFI can be calculated using this ratio:
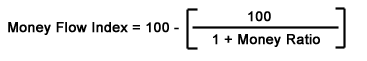
A buy signal occurs when the MFI line crosses from below the lower threshold to above the lower threshold. A sell signal occurs when the MFI line crosses from above the upper threshold to below the upper threshold.
Example of Money Flow Index
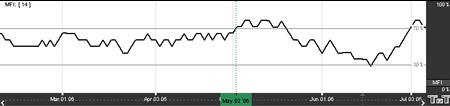
Open the Preferences Tab in your Control Panel. Select the MFI quick link at the right of the indicator window. (Once you click on the chart, the Preference tab will go back to chart settings.)
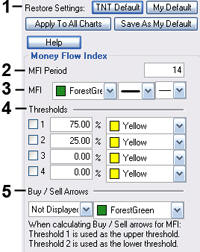 1. Restore Settings: TNT Default will change your settings back to the original software settings. My Default will change current settings to your personalized default settings. Update All MFI's will apply your selected settings on all open charts. Save As My Default will save your current personal settings.
2. MFI Period: To specify the number of days used in calculating the MFI, click in the box, highlight the current number, and type in a new value.
3. MFI: Change the color, style, and thickness of the line.
4. Thresholds: Gives you the option of displaying four threshold lines, which can be displayed as a value or a percentage in the Indicator Window. You also have the option to change the color of the threshold line.
5. Buy/Sell Arrows: Turns the display for buy/sell arrows on and off. You also have the option to change the color of the buy/sell arrows.
Momentum measures the rate of change in prices rather than actual price levels themselves. By measuring this rate of incline or decline, momentum tells whether the current trend is strengthening or weakening. If prices are rising and the momentum indicator is above the zero line, then the trend is gaining strength. If prices were rising but the indicator was sagging or went below the zero line, then we would interpret this as a sign of a coming change in trend. This is true because, although prices were still increasing, they are doing so at a decreasing rate.
The reverse would be true during a declining market. For example, think of a race car gaining 20 miles an hour each lap, until it starts to only gain 15 miles an hour, then 10 mph, then 5 mph until eventually it reaches its top speed. Like a race car, a market can not sustain growing momentum forever, and in many occurrences momentum slows before prices change direction.
Typically, the trade signals are to buy when the momentum indicator crosses from below the zero line to above it. This indicates that a new upward trend has begun, as the market is able to violate resistance levels and continue higher with increasing speed.
The sell signal would be to sell when the line crosses from above the zero line to below it. This indicates that the market is picking up speed to the downside and should be able to violate support areas. It is in this way that this unique indicator is a trend following tool.
Another way to use momentum is to establish regions of overbought or oversold. For example, in a declining market, the prices continue downward and the momentum indicator moves toward more negative but begins to level out. We would be looking for a buy signal when the indicator turned upward and out of that oversold region. It is in this way that momentum can sometimes shift ahead of the price movement. This use of the momentum indicator is a counter trend usage.
In either implementation of this indicator, the key is divergence. Seeing momentum make lower highs while prices are making higher highs, or momentum making higher lows while prices are making lower lows. Being aware of a difference in price movement and the momentum level can help the trader make informed trading decisions.
The general formula to calculate momentum is here:
MOMt = Pi - Pi-n
MOMt: The momentum indicator for the current period.
Pi: The price of the i interval.
Pin: The price n intervals ago.
n: The number of intervals or length specified.
Example: Assume the current price is 7470. This example examines a momentum study using a length of ten trading intervals. The price ten intervals ago is 7400:
MOM = 7470 - 7400 = +70
The momentum value can have a very broad range. It is a function of the length you select for the momentum and the volatility of the underlying futures contract. Thus, it could swing very wide and wildly about the zero line.
If we draw MOM with the MOMMA line, a sell signal occurs when the MOM value crosses from above the MOMMA line to below the MOMMA line, and the MOMMA line is greater than 0. A buy signal occurs when the MOM value crosses from below the MOMMA line to above the MOMMA line, and the MOMMA line is less than 0.
If we draw MOM without the MOMMA line, a buy signal occurs when the MOM value crosses from below the 0 line to above the 0 line. A sell signal occurs when the MOM value crosses from above the 0 line to below the 0 line.
Example of Momentum
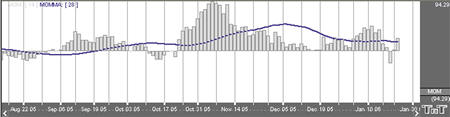
Open the Preferences Tab in your Control Panel. Select the MOM quick link at the right of the indicator window. (Once you click on the chart, the Preference tab will go back to chart settings.)
1. Restore Settings: TNT Default will change your settings back to the original software settings. My Default will change current settings to your personalized default settings. Update All MOMs will apply your selected settings on all open charts. Save As My Default will save your current personal settings.
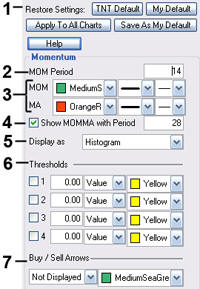 2. MOM Period: To specify the number of days used in calculating the Momentum (MOM) indicator, click in the box, highlight the current number, and type in a new value.
3. MOM/MA: Change the color, line style, and line thickness of the Moving Average and Momentum lines.
4. Show MOMMA with Period: Uncheck this box if you would like to hide the Momentum Moving Average (MOMMA) line. You can also specify the number of days used in calculating the MOMMA line.
5. Display as: The Momentum Indicator can be displayed differently. From the drop-down menu, choose either to view it as a line or as a histogram.
6. Thresholds: Gives you the option of displaying four threshold lines, which can be displayed as a value or a percentage in the Indicator Window. You also have the option to change the color of the threshold line.
7. Buy/Sell Arrows: You have the option to display buy/sell arrows on your chart according to the indicator. Click the arrow to view Displayed or Not Displayed. You also have the option to change the color of the buy/sell arrows.
The concept behind the OBV is that changes will be reflected in the OBV prior to the markets change. A rise in volume is meant to indicate a rise in money inflows to the security. Once the public continues to add money, the price of the equity should continue to rise.
Directional movement in the indicator gives foresight into the market direction. A rise in the OBV indicator gives the trader the indication that markets are on the rise; a dropping OBV is an indication of a weakening market and lower prices are soon to follow.
When market divergence is seen within the OBV indicator, one must take heed that the market is either weakening in a bullish trend, or strengthening in a bearish trend, and a market reversal is about to occur. The actual calculated value of the line itself is of little use, but the visual movement of the line is what’s important to the trader. An inclining line is the indication of a strengthening market, and a declining line is representative of declining market strength.
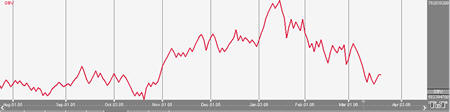
Open the Preferences Tab in your Control Panel. Select the OBV quick link at the right of the indicator window. (Once you click on the chart, the Preference tab will go back to chart settings.)
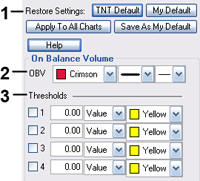 1. Restore Settings: TNT Default will change your settings back to the original software settings. My Default will change current settings to your personalized default settings. Update All OBVs will apply your selected settings on all open charts. Save As My Default will save your current personal settings.
2. Line: Choose the color, line style, and line thickness of your line.
3. Thresholds: Gives you the option of displaying four threshold lines, which can be displayed as a value or a percentage in the Indicator Window. You also have the option to change the color of the threshold line.
The PPO indicator shows the relationship between two moving averages. The PPO indicator is a modification of the highly regarded and effective MACD indicator. This enhancement provides us the ability to receive the differences between the two moving averages as a percentage. This allows the trader to easily compare stocks with different prices. For example, a PPO result of 20 means that the short term average is 20% above the long term average.
Calculation
To calculate the PPO, subtract the 26-day exponential moving average (EMA) from the nine-day EMA and divide this difference by the 26-day EMA. The end result is a percentage that tells the trader where the short-term average is relative to the longer-term average.
PPO = (Fast_EMA - Slow_EMA) / Fast_EMA
Additionally, the PPO histogram can be calculated by using the MA of a PPO itself:
PPO_Histogram = PPO - EMA_PPO
A buy signal occurs when the PPO line crosses from below the trigger line to above the trigger line. A sell signal occurs when the PPO line crosses from above the trigger line to below the trigger line.
Example of Percent Price Oscillator
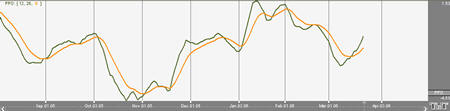
Open the Preferences Tab in your Control Panel. Select the PPO quick link at the right of the indicator window. (Once you click on the chart, the Preference tab will go back to chart settings.)
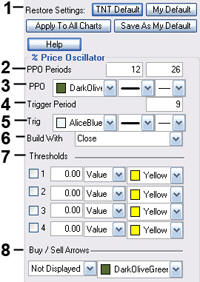 1. Restore Settings: TNT Default will change your settings back to the original software settings. My Default will change current settings to your personalized default settings. Apply To All Charts will apply your selected settings on all open charts. Save As My Default will save your current personal settings.
2. PPO Periods: Specify the number of days to be used in calculating the PPO.
3. PPO: Choose the color, line style, and line thickness of your PPO line.
4. Trigger: Specify the number of days used in calculating the Trigger.
5. Line: Choose the color, line style, and line thickness of your Trigger line.
6. Build With: Choose either Close, Open, High, or Low to build with.
7. Thresholds: Gives you the option of displaying four threshold lines, which can be displayed as a value or a percentage in the Indicator Window. You also have the option to change the color of the threshold line.
8. Buy/Sell Arrows: Turns the display for buy/sell arrows on and off. You also have the option to change the color of the buy/sell arrows.
Centerline Crossovers: The PVO oscillates above and below the zero line. A PVO above zero indicates that volume levels are generally above average and relatively heavy. When the PVO is below zero, volume levels are generally below average and light. When PVO is positive, the shorter EMA of volume is greater than the longer EMA of volume. When PVO is negative, the shorter EMA of volume is less than the longer EMA of volume.
Directional Movement: The general overall direction of the PVO gives the trader a visual of market momentum and direction. A rising PVO signals volume levels are increasing, and a falling PVO signals volume levels are decreasing.
Moving Average Crossovers: The last variable in the PVO forms the signal line. For example, PVO (12,26,9) would include a 9-day EMA of PVO as well as a histogram representing the difference between the PVO and its 9-day EMA. When PVO moves above its signal line, volume levels are generally increasing. When PVO moves below its signal line, volume levels are generally decreasing.
Movements in the PVO are completely separate from price movements. Movements in PVO can correlate with price movements to assess the degree of buying or selling pressure.
Calculation
The calculation of PVO is here:
Volume Oscillator (%) - PVO = [(Vol 12-day EMA - Vol 26-day EMA)/Vol 12-day EMA] x 100
Increasing and decreasing the exponential moving average variables changes the PVO to reflect a longer or shorter trading time period. The absolute values of the PVO indicator are not as important as the crossovers of the moving averages as well as a crossover above or below the zero line.
There are three additional methods on the next page of acquiring market strength and weakness information from the PVO.
When the PVO crosses above the zero line, volume is increasing and an increase in price is anticipated.
When the PVO crosses below the zero line, volume is decreasing and a decrease in price and a weakening market are anticipated.
Simple directional movement can be one of the greatest strengths of the PVO indicator. When the line is ascending, volume is increasing, so therefore markets should increase. When the line is descending, volume is decreasing, therefore the market should weaken and decrease.
Buy/Sell Signals
A buy signal occurs when the PVO line crosses from below the trigger line to above the trigger line. A sell signal occurs when the PVO line crosses from above the trigger line to below the trigger line.
Example of Percent Volume Oscillator
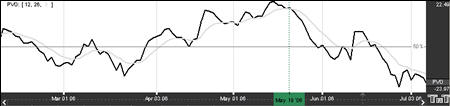
Preferences
Open the Preferences Tab in your Control Panel. Select the PVO quick link at the right of the indicator window. (Once you click on the chart, the Preference tab will go back to chart settings.)
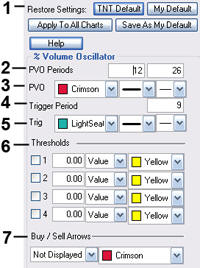 1. Restore Settings: TNT Default will change your settings back to the original software settings. My Default will change current settings to your personalized default settings. Update All PVOs will apply your selected settings on all open charts. Save As My Default will save your current personal settings.
2. PVO Periods: Specify the number of days to be used in calculating the PVO.
3. PVO: Choose the color, line style, and line thickness of your line.
4. Trigger: Specify the number of days used in calculating the trigger period.
5. Line: Choose the color, line style, and line thickness of your trigger line.
6. Thresholds: Gives you the option of displaying four threshold lines, which can be displayed as a value or a percentage in the Indicator Window. You also have the option to change the color of the threshold line.
7. Buy/Sell Arrows: Turns the display for buy/sell arrows on and off. You also have the option to change the color of the buy/sell arrows.
Williams’s basic rule is simple: when the %R is lower than 20% and becomes greater than 20%, it is interpreted as a buy signal. Conversely, when the %R is higher than 80% and becomes lower than 80%, a sell signal is activated.
Changing the sensitivity of the indicator to work for you is essential to making the study a better tool. The longer the period for the %R, the less sensitive it will be. The indicator will move less but will be more smoothed. A number of technical traders use a value that is less volatile, or in other words, a larger value. Many traders find it better to use a strategy where the market leaves the areas of overbought/ oversold before entering a trade position. In either case, using solid exit strategies is important with this indicator.
Calculation
You must first determine the highest high and lowest low for the length of the interval. This is the trading range for the specified interval:
%Rt = ( (Highn - Closet) / (Highn - Lown) ) x -100
%Rt: The percent of the range for the current period.
Highn: The highest price during the past n trading periods.
Closet: The closing price for the current period.
Lown: The lowest price during the past n trading periods.
n: The length of the interval.
Example: Assume the market is Treasury Bills. The high for the past ten trading intervals is 9275, and the low is 9125. The closing price in the current period is 9267.
This is what you get if you substitute those values in the equation:
%R = ( (9275 - 9267) / (9275 - 9125) ) x 100 br /> = (8 / 150) x 100
= 5.33
%Rt = ( (Closet - Lown) / (Highn - Lown) ) x -100
Buy/Sell Signal
A buy signal occurs when the %R line crosses from below the lower threshold to above the lower threshold. A sell signal occurs when the %R line crosses from below the upper threshold to below the upper threshold.
Example of Williams %R
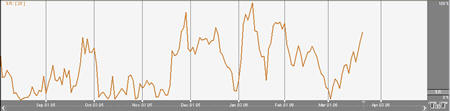
Preferences
Open the Preferences Tab in your Control Panel. Select the %R quick link at the right of the indicator window. (Once you click on the chart, the Preference tab will go back to chart settings.)
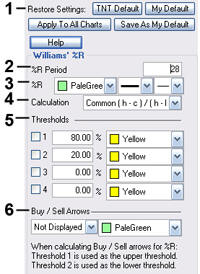 1. Restore Settings: TNT Default will change your settings back to the original software settings. My Default will change current settings to your personalized default settings. Update All %Rs will apply your selected settings on all open charts. Save As My Default will save your current personal settings.
2. %R Period: To specify the number of days used in calculating %R simply click in the box, highlight the current number, and type in a new value.
3. %R: Change the color, style, and thickness of the line.
4. Calculation: Choose between common or updated calculations.
5. Thresholds: Gives you the option of displaying four threshold lines, which can be displayed as a value or a percentage in the Indicator Window. You also have the option to change the color of the threshold line.
6. Buy/Sell Arrows: Turns the display for buy/sell arrows on and off. You also have the option to change the color of the buy/sell arrows.
The ROC indicator is used to help a trader determine the rate at which a market is either increasing or decreasing in strength or weakness. A rising rate of change indicates an advancing market, while a decreasing rate of change indicates a declining market. As the rate of change line approaches the centerline, the rate of change is considered to be in equilibrium. This is somewhat of a misnomer, since the ROC is on a relative scale and scales against historical rates. What is equilibrium today will not be the equilibrium line down the road, and what is not equilibrium today will appear to be so from a historical point of view.
Comparing the ROC’s of different time-spans improves the accuracy of the analysis. A 12 month period is usually the most reliable for long-term trends, and a 3 or 6 month period works well for intermediate trends. A 10 or 12-day ROC is a good short-term indicator, oscillating in a fairly regular cycle.
The lower the ROC, the more undersold the market and the more likely a recovery. Although the opposite may hold true in that the higher the ROC, the more overbought the market, both extremes can indicate the formation of a sideways channel.
Calculations
The calculation for the ROC is here:
ROC = 100 x (Today’s close - Close 10 periods ago) / (Close 10 periods ago)
Example of Rate of Change
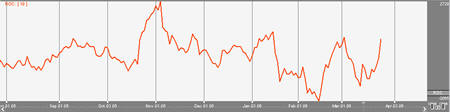
Preferences
Open the Preferences Tab in your Control Panel. Select the ROC quick link at the right of the indicator window. (Once you click on the chart, the Preference tab will go back to chart settings.)
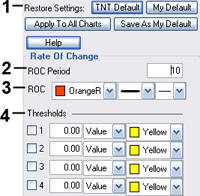 1. Restore Settings: TNT Default will change your settings back to the original software settings. My Default will change current settings to your personalized default settings. Update All ROCs will apply your selected settings on all open charts. Save As My Default will save your current personal settings.
2. Period: Specify the number of days to be used in calculating the SRSI.
3. Line: Choose the color, line style, and line thickness of your line.
4. Thresholds: Gives you the option of displaying four threshold lines, which can be displayed as a value or a percentage in the Indicator Window. You also have the option to change the color of the threshold line.
RSI computes the difference in recent prices as a solid line and plots this line on a scale similar to the scale used by Stochastics. The area above 70 is generally considered to be the overbought region, and the region below 30 is referred to as the oversold region. Simply selling in the overbought region and buying when the RSI is in the oversold region is not a consistent method of trade. Trade signals are not generated until the RSI leaves these regions. A sell signal would not be present until the RSI has begun sloping down and leaves the 70 region.
A buy signal, in the simple methodology associated with this pattern, is derived when RSI leaves the oversold region, crosses from below 30 to above it. Just like sell signals, RSI buy signals are present when the market begins to turn and the indicator leaves the oversold region.
Another use of the RSI is to look for a divergence in prices, in the case of a market making higher highs or lower lows and the RSI failing to follow suit. This difference in the indicator and the market could be a signal that the market lacks the momentum to continue its current price direction. So, you may be able to take a position sooner using this strategy, than you would with the previous way. Wilder says that this divergence is “the single most indicative characteristic of the RSI.”
In its calculation the RSI indicator uses a moving average of price changes over the period. You can select which type of moving average is used to produce the desired amount of smoothing on the RSI indicator.
Calculation
The RSI computations are not difficult, but they are tedious. You first calculate the difference between the current closing price and the previous closing price:
DIFt = Closet - Closet-1
If that difference is a positive value, then it is an up period, which means the current close is higher than the previous close. If the difference is negative, then it is a down period, which means the current close is below the previous close. The DOWN value is always a positive number for all computations. It is the absolute value of a negative DIF. The worksheet on the next page shows the calculations needed to create a 9 period RSI.
| Day | Current Close | Previous Close | Dif | Up | Down |
| 1 | 7450 | 7430 | +20 | 20 | 0 |
| 2 | 7460 | 7450 | +10 | 10 | 0 |
| 3 | 7470 | 7460 | +10 | 10 | 0 |
| 4 | 7480 | 7470 | +10 | 10 | 0 |
| 5 | 7485 | 7480 | +5 | 5 | 0 |
| 6 | 7490 | 7485 | +5 | 5 | 0 |
| 7 | 7480 | 7490 | -10 | 0 | 10 |
| 8 | 7470 | 7480 | -10 | 0 | 10 |
| 9 | 7455 | 7470 | -15 | 0 | 15 |
| Totals | 60 | 35 |
You now compute the up and down averages:
Ut = (UP1 +... + UPn) / n
Dt = (DOWN1 +... + DOWNn) / n
UT: The up average for the current period.
DT: The down average for the current period.
UPn: The UP value for the nth period.
DOWNn: The DOWN value for the nth period.
n: The number of periods for the RSI.
Use the values from the worksheet to find the up average:
U = 60 / 9
= 6.67
Use the same values to find the down average:
D = 35 / 9
= 3.89
The general formula for the RSI:
RSIt = ( UT / (UT + DT) ) x 100
Use the general formula with the above values:
RSI = ( 6.67 / ( 6.67 + 3.89 )) x 100
= 63.16
Assume the market continues the downward trend. The next DIF value is -15, which sets the UP value to 0 and the DOWN value to 15. Calculate the next up and down average by using Wilder’s accumulative moving average technique:
UT = ( (UT-1 x (n-1) ) + UPt) / n
= ( (6.67 x (9 -1) ) + 0) / 9
= 5.93
DT = ( ( DT-1 x (n-1) ) + DOWNt) / n
= ( ( 3.89 * (9 - 1) ) + 15) / 9
= 5.12
The value for the new RSI equals 53.67:
RSI = ( (5.93) / (5.93 + 5.12)) x 100
= 53.67
Buy/Sell Signals
A buy signal occurs when the RSI line crosses from below the lower threshold to above the lower threshold. A sell signal occurs when the RSI line crosses from above the upper threshold to below the upper threshold.
Example of Relative Strength Index
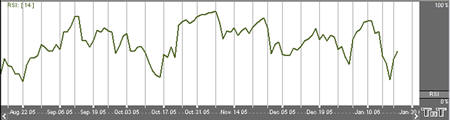
Open the Preferences Tab in your Control Panel. Select the RSI quick link at the right of the indicator window. (Once you click on the chart, the Preference tab will go back to chart settings.)
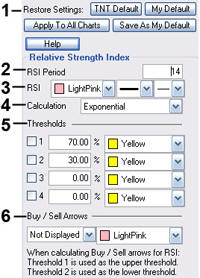 1. Restore Settings: TNT Default will change your settings back to the original software settings. My Default will change current settings to your personalized default settings. Update All RSIs will apply your selected settings on all open charts. Save As My Default will save your current personal settings.
2. RSI Period: To specify the number of days used in calculating the RSI click in the box, highlight the current number, and type in a new value.
3. RSI: Change the color, line style, and line thickness of the RSI.
4. Calculation: Choose between Exponential, Simple, and Wilder’s Smoothing calculations.
5. Thresholds: You are given the option to view four threshold lines in the Indicator Window. The crossing of the RSI line below the Upper Threshold is a buy signal. The crossing of the RSI line above the Lower Threshold is a sell signal. You can also change the color of the threshold lines.
6. Buy/Sell Arrows: You have the option to display buy/sell arrows on your chart according to the indicator. Click the arrow to view Displayed or Not Displayed. You also have the option to change the color of the buy/sell arrows.
The Stochastics RSI is a combination of these two indicators, where the %K within the Stochastics formula is replaced by the RSI. The formula is then set on a 0 to 100 scale for both the Stochastics indicator as well as the RSI is read in much the same manner as the traditional RSI. When the SRSI reaches up into the upper region above the upper threshold line, the market is considered overbought and anticipate a reversal of the trend. When the SRSI reaches down into the lower region below the lower threshold, the market is considered oversold and a reversal is anticipated. Traditionally, the upper threshold marker is set at 70% and the lower marker is set at 30%.
Calculation
The calculation for the SRSI is here:
StochRSI = (RSI - LowRSIn) / (HighRSIn - LowRSIn)
RSI: The current level of the RSI indicator.
LowRSIn: The lowest level the RSI reached over the last n periods.
HighRSIn: The highest level the RSI reached over the last n periods.
Buy/Sell Signals
A buy signal occurs when the SRSI line crosses from below the lower threshold to above the lower threshold into the channel. A sell signal occurs when the SRSI line crosses from above the upper threshold to below the upper threshold into the channel.
Example of Stochastic Relative Strength Index
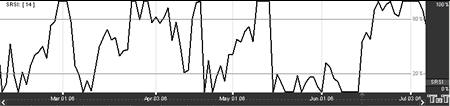
Preferences
Open the Preferences Tab in your Control Panel. Select the SRSI quick link at the right of the indicator window. (Once you click on the chart, the Preference tab will go back to chart settings.)
 1. Restore Settings: TNT Default will change your settings back to the original software settings. My Default will change current settings to your personalized default settings. Update All SRSIs will apply your selected settings on all open charts. Save As My Default will save your current personal settings.
2. SRSI Period: Specify the number of days to be used in calculating the SRSI.
3. Underlying RSI Period: Specify the number of days used in calculating the Underlying RSI.
4. Calculation: Choose from Exponential, Simple, or Wilder’s Smoothing.
5. Line: Choose the color, line style, and line thickness of your line.
6. Thresholds: Gives you the option of displaying four threshold lines, which can be displayed as a value or a percentage in the Indicator Window. You also have the option to change the color of the threshold line.
7. Buy/Sell Arrows: Turns the display for buy/sell arrows on and off. You also have the option to change the color of the buy/sell arrows.
Slow Stochastics are interpreted the same as Fast Stochastics. Quite often the faster of the two indicators moves in and out of the overbought/oversold regions quickly.
Calculation
The calculations for the slow stochastic are similar to the normal stochastic. The first step in computing the stochastic indicator is to determine the n period high and low. Suppose you specified twenty periods for the stochastic. Determine the highest high and lowest low during the last twenty trading intervals. It determines the trading range for that time period. The trading range changes on a continuous basis.
The calculations for the %K is here:
%Kt = ( (CloseT - LowN) / (HighN - LowN) ) x 100
%Kt: The value for the first %K for the current time period.
CloseT: The closing price for the current Time period.
LowN: The lowest low during the N periods.
HighN: The highest high during the N time periods.
N: The value you specify.
Once you obtain the %K value, you start computing the %D value, which is an accumulative moving average. Since the %D is a moving average of a moving average, it requires several trading intervals before the values are calculated properly. If you specify a 20 period stochastic, the software system requires 26 trading intervals before it can calculate valid %K and %D values. The formula for the %D is here:
%DT = ( (%DT-1 x 2) + %Kt) / 3
%DT: The value for %D in the current period.
%DT-1: The value for %D in the previous time period.
%Kt: The value for %K in the current period.
The values 2 and 3 are constants. You specify the constants and the length of the time period to examine for the trading range.
Once the %K and %D values for the normal stochastic are derived, the slow stochastic can be computed. The formula for the slow stochastic is here:
%KSLOW = %DNORMAL
%DSLOWt = ( ( %D SLOWt-1 x 2 ) + %K SLOWt-1 ) ) / 3
%KSLOW: The %D for the normal stochastic.
%DSLOWt: Slow %D value for the current period.
%DSLOWt-1: The slow %D for the previous period.
%KSLOWt-1: The slow %K for the previous period.
The values 2 and 3 are the smoothing constants. You may select different values.
Buy/Sell Signals
A buy signal occurs when the %K line crosses from below %D to above %D and both lines are less than the lower threshold. A sell signal occurs when the %K line crosses from above the %D line to below the %D line and both lines are greater than the upper threshold.
Example of Slow Stochastics
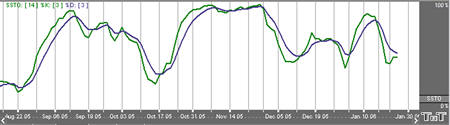
Preferences
Open the Preferences Tab in your Control Panel. Select the SSTO quick link at the right of the indicator window. (Once you click on the chart, the Preference tab will go back to chart settings.)
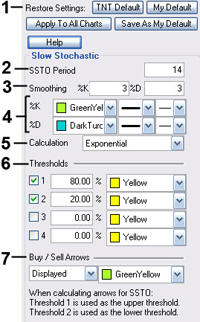 1. Restore Settings: TNT Default will change your settings back to the original software settings. My Default will change current settings to your personalized default settings. Update All SSTOs will apply your selected settings on all open charts. Save As My Default will save your current personal settings.
2. SSTO Period: To specify the number of days used in calculating the Slow Stochastics indicator, click in the box, highlight the number, and type in a new value.
3. Smoothing: To specify the number of days used in calculating smoothing, click in the box, highlight the number, then type in a new value.
4. %K/%D: Change the color, line style and line thickness of the %K and %D lines.
5. Calculation: Choose from Exponential, Simple, and Wilder’s Smoothing for the type of formula used to calculate the indicator.
6. Thresholds: You are given the option to view four threshold lines in the Indicator Window. The crossing of the %D line above the %K line is a sell signal and only confirmed if this crossing occurred above the Upper Threshold line. The crossing of the %D line below the %K line is a buy signal and only confirmed if this crossing occurred below the Lower Threshold line. You can also change the color of the threshold lines.
7. Buy/Sell Arrows: You have the option to display buy/sell arrows on your chart according to the indicator. Click the arrow to view Displayed or Not Displayed. You also have the option to change the color of the buy/sell arrows.
TRIX was designed to filter out the minor, less significant moves within a market trend. This is done, just as other traditional indicators have done in the past, by utilizing multiple moving averages.
Convergence and Divergence are common uses of the TRIX indicator. Adding the trigger line crossover provides the trader with a Buy/Sell Signal generated from the crossing of the two moving averages.
Calculation
To calculate TRIX, first pick a period with which to create an exponential moving average of the closing prices. For a 15-day period the calculations would look like this:
Calculate the 15-day exponential moving average of the closing price.
Calculate the 15-day exponential moving average of the moving average calculated in step #1.
Calculate the 15-day exponential moving average of the moving average calculated in step #2.
The result is triple exponentially smoothing the moving average of closing prices, greatly reducing volatility.
Finally, calculate the 1-day percent change of the moving average calculated in step #3.
Buy/Sell Signals
A buy signal occurs when the TRIX value crosses from below the trigger line to above the trigger line. A sell signal occurs when the TRIX value crosses from above the trigger line to below the trigger line.
Example of Triple Exponential Average
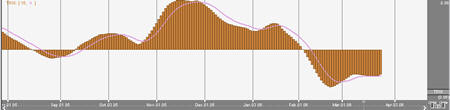
Preferences
Open the Preferences Tab in your Control Panel. Select the TRIX quick link at the right of the indicator window. (Once you click on the chart, the Preference tab will go back to chart settings.)
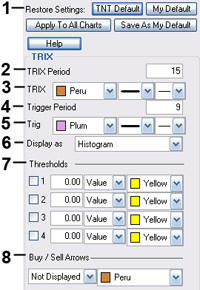 1. Restore Settings: TNT Default will change your settings back to the original software settings. My Default will change current settings to your personalized default settings. Update All TRIXs will apply your selected settings on all open charts. Save As My Default will save your current personal settings.
2. Period: Specify the number of days to be used in calculating the SRSI.
3. Line: Choose the color, line style, and line thickness of your line.
4. Trigger Period: Specify the number of days used in calculating the Underlying RSI.
5. Line: Choose the color, line style, and line thickness of your trigger line.
6. Display as: Choose if you want to see a histogram or line.
7. Thresholds: Gives you the option of displaying four threshold lines, which can be displayed as a value or a percentage in the Indicator Window. You also have the option to change the color of the threshold line.
8. Buy/Sell Arrows: Turns the display for buy/sell arrows on and off. You also have the option to change the color of the buy/sell arrows.
This indicator, as with the RSI indicator, works on an overbought and oversold region. Mr. Williams states that the upper threshold should start at 70% and the lower threshold at 30%, but depending on the market, the volatility, and the settings, you may need to adjust the thresholds to either higher or lower settings to obtain signals.
Once the ULT line crosses above the upper threshold into the overbought region, it is time to anticipate a reversal in price and lower prices to ensue. When the ULT line crosses below the lower threshold, it is time to anticipate a reversal in price and anticipate prices to rise once again. Many traders like to use a 50% line to reconfirm price action. Crossing the 50% line is a confirmation of the overall trend.
The True Low (TL) is the lower of today’s low or yesterday’s close. Calculate today’s Buying Pressure (BP) like this:
BP = Today’s close - Today’s TL
Calculate today’s True Range (TR) by finding the largest outcome of one of the following equations:
TR = Today’s High - Today’s Low
Today’s High - Yesterday’s Close
Today’s Close - Today’s Low
Calculate BPSum1, BPSum2, and BPSum3 by adding up all of the BPs for each of the three specified time frames. Calculate TRSum1, TRSum2, and TRSum3 the same way with the TR’s.
The Raw Ultimate Oscillator (RawUO) is calculated here:
RawUO = 4 x (BPSum1 / TRSum1) + 2 x (BPSum2 / TRSum2) + (BPSum3 / TRSum3)
The Final Ultimate Oscillator is calculated here:
FUO = [ RawUO / (4 + 2 + 1) ] x 100
A buy signal occurs when the ULT line crosses from below the lower threshold to above the lower threshold. A sell signal occurs when the ULT line crosses from above the upper threshold to below the upper threshold.
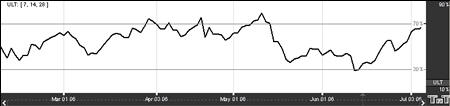
Open the Preferences Tab in your Control Panel. Select the ULT quick link at the right of the indicator window. (Once you click on the chart, the Preference tab will go back to chart settings.)
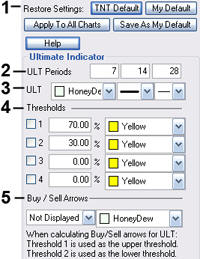 1. Restore Settings: TNT Default will change your settings back to the original software settings. My Default will change current settings to your personalized default settings. Update All ULTs will apply your selected settings on all open charts. Save As My Default will save your current personal settings.
2. ULT Periods: Specify the number of days to be used in calculating the SRSI.
3. Line: Choose the color, line style, and line thickness of your line.
4. Thresholds: Gives you the option of displaying four threshold lines, which can be displayed as a value or a percentage in the Indicator Window. You also have the option to change the color of the threshold line.
5. Buy/Sell Arrows: Turns the display for buy/sell arrows on and off. You also have the option to change the color of the buy/sell arrows.
Volume is a measurement of the number of contracts traded in a day. It is a sign of market activity. In liquid markets, these numbers will be consistently higher than in a thin or illiquid market. These numbers are always a day behind, because it takes the exchange that long to tabulate these figures. When displayed, Track 'n Trade High Finance offsets these values to put them beneath their respective data in the chart, consequently there is not a value for volume for the most recent day of any contract. Volume indicates participation and urgency. This tells the trader which market is the correct one to be in based on its participation.
Volume measures the number of contracts that changed hands during that trading session. This indicator of market activity can show whether trade was heavy or light. That will give you an idea of the possible volatility present in that market. VOL does not give straight buy or sell signals or have set trading rules. Rather it shows the cyclical tendencies of the market. The flow of the underlying market can be represented. Looking at VOL shows whether new buyers or sellers are entering the market or if they are liquidating positions.
There are basic common sense rules for this indicator. If the prices are up and VOL is increasing, the market is strong. If the prices are up and VOL is declining, the market is getting weaker. If the prices are down and VOL is rising, the market is getting stronger. If the prices are down and VOL is declining, the market is getting weaker.
In bull markets, volume tends to increase during rallies, and tends to decrease on reactions. In bear markets, volume tends to increase on declines and decrease during rallies. Trading volume usually increases dramatically at tops and bottoms. Looking at the volume can help you determine the liquidity of the market.
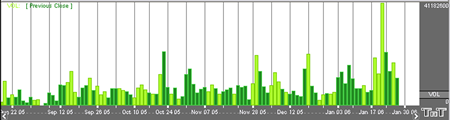
This study has no computations. The values for volume are transmitted from the exchanges. However, the actual volume figures are always one day behind price information. You will not know Monday's volume until Tuesday at approximately noon (for U.S. markets - central time). That is due to the exchanges and their reporting requirements.
Open the Preferences Tab in your Control Panel. Select the VOL quick link at the right of the indicator window. (Once you click on the chart, the Preference tab will go back to chart settings.)
Restore Settings: TNT Default will change your settings back to the original software settings. My Default will change current settings to your personalized default settings. Apply To All Charts will apply your selected settings on all open charts. Save As My Default will save your current personal settings.
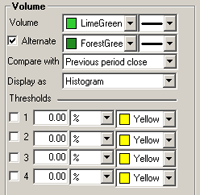 Volume: Choose the color, line style, and line thickness of your Volume line.
Alternate: Select to view the Volume indicator in two colors. Choose the color, line style, and line thickness of your Alternate line.
Compare with: When the Alternate option is selected, you can compare the price day to day based on Previous Period Open (high, low, and close) or the Current Period Open (high or low).
Display as: The VOL indicator can be displayed differently. From the dropdown menu, choose either to view it as a line or as a histogram.
View up to four Thresholds at values and colors of your choice. When calculating buy/sell signals, Threshold 1 is used as the upper threshold and Threshold 2 is used as the lower threshold (default values set at 80 and 20).
The Accounting Simulator Expansion Pack helps you keep track of your profits and losses, simulate trading, and perfect your trading strategy. You will be able to view your open and closed orders, your account activity, and keep track of your broker fees and pip spreads. The Accounting Simulator Window will be on the bottom of your screen, below the Chart Window. The buttons on the left of the Accounting Simulator Window are referred to as your Accounting Control Panel, see below.

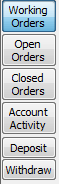 Once you have open orders that have filled, they will show up under the Open Profit button. The Closed Profit button will show all closed orders, and the Account Activity button shows all of your account activity from deposits and withdrawals to open and closed orders. The Order, Deposit, and Withdrawal buttons below pull up screens that help you place orders, make deposits, and create withdrawals. Using the Accounting Control Panel, it is easy to see where you stand as far as your profits and losses. You can also view specific information as the screenshots below demonstrate.
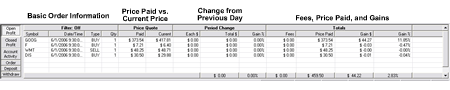
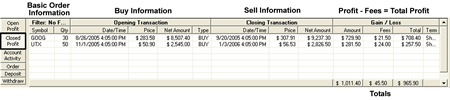
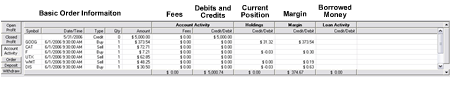
The following Simulation Tools will help you simulate your trading experience on your chart.
 |
Buy/Sell: Select and left-click in chart to place stop order, right-click to place limit order. |
| Autofollow Mode: (Green) Plays your open charts with incoming data. Simulation Mode: (Red) Activates Play Controls |
|
| Play to Date: Play all charts to a certain date. | |
 |
Beginning: Moves to the first day in the chart. |
| Reverse Step 28: Moves back 28 price bars and stops. | |
| Reverse Step 1: Moves back 1 price bar and stops. | |
| Rewind: Plays chart backwards quickly. | |
| Play: Plays chart backwards one tick at a time. | |
| Stop: Stops any play buttons. | |
| Play: Plays chart forward one tick at a time. | |
| Fast Forward: Plays chart forward quickly. | |
| Step 1: Moves forward 1 price bar and stops. | |
| Step 28: Moves forward 28 price bars and stops. | |
| End: Moves to the last day in the chart. |
Think of your Accounting Simulator as a bank account. You need to deposit money before you can use it. You can also withdraw money when you would like, or you may need to deposit more money if you spend what is already in your account. The first thing you will need to do is make a deposit.
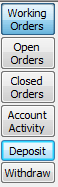 To make a deposit, click on the Deposit button on the Accounting Control Panel.
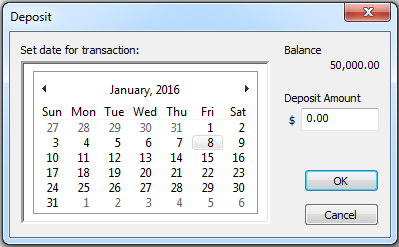
The Deposit window will appear. The date on this screen will be the same date your chart has played to. To change the date of your deposit, click on the arrows to go forward or backward by month, then click on the day of the month. Under amount, enter the dollar amount you want to deposit.
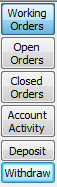 To make a withdrawal, the screen is the same as above, and the procedure is the same. The only difference will be that money will be taken out of your account instead of adding to it.
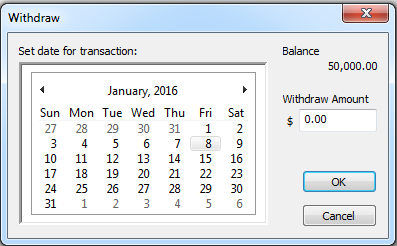
Now that you have money in your simulated account, you can start placing orders. There are two ways to place an order. You can click on the Buy/Sell button on the Simulation Toolbar then on the chart where you want to place your order. The Account tab will open in your control panel with the order placement box filled out with the correct information:
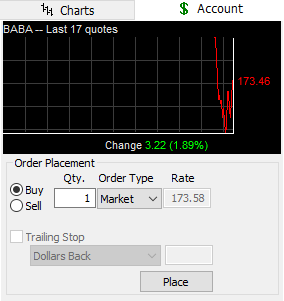
Order Placement: Choose to "Buy" or "Sell," then the quantity, the order type (see the list of definitions for each order type in this section), and the price at which you want your order to be filled. Once your order is placed, it will not show in your Accounting Simulator until the order is filled.
Trailing Stop: This can only be used on a Stop Order. Check the box to use a Trailing Stop on your order. Your Trailing Stop will follow an open position and protect profits by trailing a market rise or decline. You can choose to set your Trailing Stop by Dollar amount, Price Bars Back, or by following the PSAR or Zig Zag Indicators.
*If you have purchased the Bulls' n Bears Trading System then you will also have the option to follow the BNB Blue Light.
A trailing stop is a feature that helps you protect profits. As opposed to a Stop Loss order that is set to a certain price, a Trailing Stop moves with the market and follows an order, changing it's price as it follows the parameters set in the order. Track 'n Trade will watch each of your positions. Each time one of your long positions goes up, Track 'n Trade adjusts your Trailing Stop according to the setting you set at the time you placed your order. If the prices moves back down a predetermined amount, you will hit the trailing stop, and the order will automatically sell your shares. Short positions work the same way, but the direction is reversed.
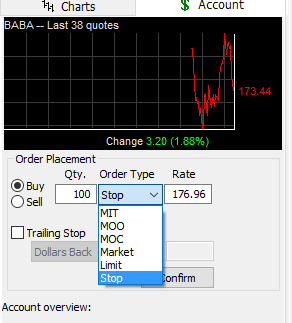 Stop Order - Place a buy stop order above the market price; place a sell stop order below the market price. A stop order becomes a MARKET ORDER when the specified price is reached. Track 'n Trade fills these orders at the specified price if the price is within the trading range of the fill date, or at the opening price of the fill day.
Market Order - A market order does not specify a price, it is executed at the best possible price available. A market order can keep you from "chasing" a market. Track 'n Trade fills these orders at the opening price of the next day's trading.
(MOO) Market On Open - This is an order that you wish to be executed during the opening range of trading at the best possible price obtainable within the opening range. Track 'n Trade will fill these orders at the opening price of the next day's trading.
(MOC) Market on Close Order - Market On Close orders will be filled during the final minutes of trading at whatever price is available. Track 'n Trade will fill these orders at the closing price of the next day's trading.
(MIT) Market If Touched - Similar to a limit order, orders to buy are placed below the current price; orders to sell are placed above the current price. MIT orders fill once the limit price is touched or passed through. Track 'n Trade will fill limit orders at the limit price on the day your order fills if that price is in the trading range, or at the opening price of that day.
Limit Order - Limit Orders to buy are placed below the current price; limit orders to sell are placed above the current price. The market may touch a limit price several times without filling. In most cases, the market must trade BETTER than the limit for the order to fill. Track 'n Trade fills limit orders when the market trades BETTER then the limit price.
You have the ability to edit an order and change the properties by right-clicking on the order.
Right Click on the order you want to edit and the window will appear. Enter your changes in the top portion of the screen, which is a copy of your original order screen (see Placing an Order paragraph for details). The bottom half of the screen is a history of the order, which can not be changed.
The option to cancel an order is only shown when an order is not filled. An order cannot be canceled until after it is filled, it can only be deleted. Canceled orders will still show on your chart, but will have an X through them. Deleted orders will completely disappear from the chart.
Restore Settings: Click on "TNT Default" if you would like to see or restore original software settings. Click on "My Default" to return to your personalized default settings. Click on "Apply To All Charts" if you would like to see your selected settings on all open charts. Click on "Save As My Default" to save your personal settings. All charts opened from the time you save your settings will have those specific settings applied to them.
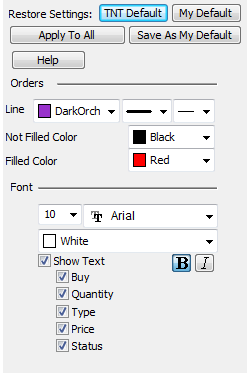
Line: Choose the color, style, and thickness of the line.
Not Filled/Filled: Choose the color of the arrow on your order for each status.
Font: From here you have the ability to change the size, font, and color of the text.
Show Text: Check box if you want the order text to show on your chart.
You can view your orders in the Charts tab of your Control Panel. Under the Position label, you will see an arrow and a number. The number accounts for how many orders you have in the market. The arrow will be red or green and pointing up or down.
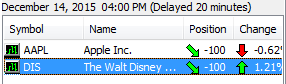
Red: You are losing money
Green: You are making money
Up: You are going long
Down: You are going short

With the Bulls ‘n Bears Red Light, Green Light, Blue Light trading method/system you have simple to understand entry and exit signals displayed visually on the chart.
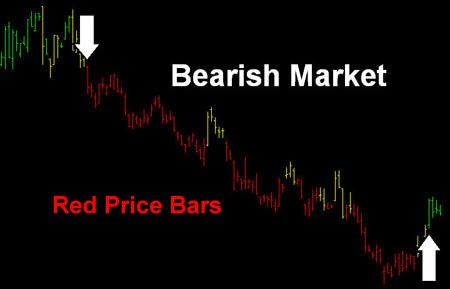
Indicates the beginning of a bearish trend, and that the contract has started to move downward, identifying a possible short entry point.
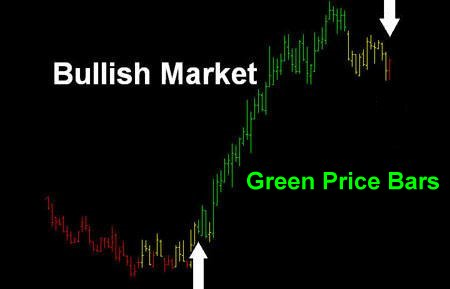
Indicates the trend of a market has begun to move upward, identifying a possible long entry point.
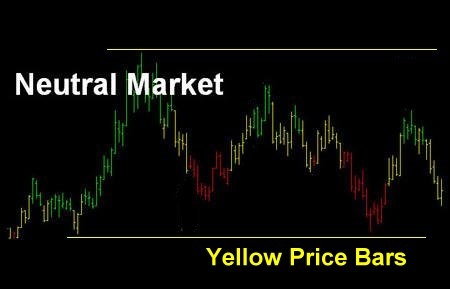
Indicates the trend of the market has entered a sideways or neutral time frame.
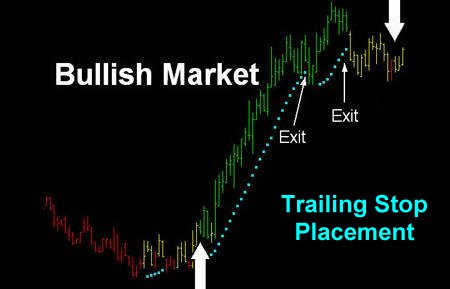
The Parabolic stop is used within the Bulls ‘n Bears system as the key point for managing your stop loss risk while trading, helping you to identify exit and stop loss placement points after entering a trade.
1. Restore Settings: TNT Default will change your settings back to the original software settings. My Default will change current settings to your personalized default settings. Apply To All Charts will apply your selected settings on all open charts. Save As My Default will save your current personal settings.
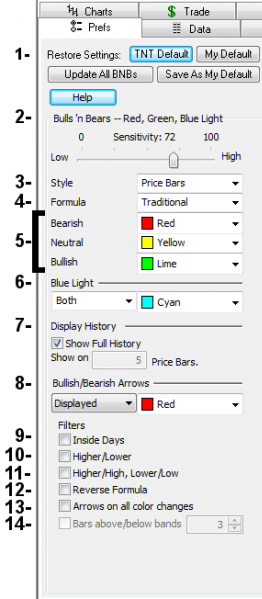 2. Sensitivity: A higher sensitivity will give you earlier bullish/bearish arrows, while a lower sensitivity will wait to give you the bullish bearish arrows until a trend is established.
3. Style: Choose the price bar style you want to view on your chart.
4. Formula: A Traditional style will widen the neutral (yellow) positions and is a more conservative approach. A Progressive style will narrow the neutral positions, and an Aggressive style will eliminate the neutral positions on your chart. Bollinger Bands, Keltner Bands, & 10x8 MAC are incorporated into the Bulls 'n Bears Proprietary formula so that they generate individual buy & sell signals. When selecting these three indicators the settings will appear in the preference dialog box.
5. Bearish/Neutral/Bullish: You can change the color of the Bearish, Bullish, and Neutral price bar indicators.
6. Blue Light: The blue light indicates where to place your stop loss. You can choose to display them only on the bullish or bearish side of the market, both sides, or not at all. You can also change its color.
7. Show Full History: To view the bullish/bearish tendencies on all the price bars on your chart, check the box. To limit the bullish/bearish tendencies to a specific number of price bars at the end of a chart as well. Uncheck the box and enter the number of price bars you would like to view.
8. Bullish/Bearish Arrows: Choose to display or not to display the Bullish/Bearish arrows and select the color of the arrows.
9. Inside Days Filter: Excludes taking into consideration inside days/price bars when calculating bullish/bearish, buy/sell arrows. (An inside day, or inside price, is a price bar where the high of the bar is lower than the previous price bar high, and the low of the bar is higher than the previous price bar low.
10. Higher/Lower Filter: Excludes taking into consideration price bars which have a lower close than its open when calculating a bullish/buy arrow, and a higher close than its open when calculating a bearish/sell signal. (Price bar closed "higher" than it opened.) (Price bar closed “lower” than it opened.)
11. Higher/High, Lower/Low Filter: Excludes taking into consideration price bars that do not have a higher close than the previous price bars high for bullish/buy signals, or excludes price bars that do not have a lower close than the previous price bars low when calculating bearish/sell signals. (Close “higher" than previous price bar “high.”) (Close “lower” than previous price bar “low.”)
12. Reverse Formula: This option reverses the buy/sell signals. Changing a buy signal to a sell signal and a sell signal to a buy signal
13. Arrows on all color changes: Selecting this option will place a buy/sell signal anytime the Bulls 'n Bears color changes.
14. Bars above/below bands: The buy/sell signals for the Bollinger Bands, Keltner Bands, and the 10x8 MAC will be adjusted based on how many bars are above or below the bands. For example, if you are looking for a buy/sell signal on the Bollinger Bands and want it to be 3 bars above or below bands prior to generating a signal, then the tic/pip/bar must close above or below the upper/lower limit three consecutive times before a signal is generated.
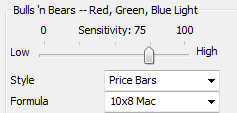 A buy signal is generated when a complete price bar, open/high/low/close appears above the upper 10x8 Band, also, that bar, along with any subsequent bar that maintains a complete open/high/low/close above the upper 10x8 Band is colored green.
A sell signal is generated when a complete price bar, open/high/low/close appears below the lower 10x8 Band, also, that bar, along with any subsequent bar that maintains a complete open/high/low/close below the lower 10x8 Band is colored red.
A neutral market, according to the 10x8 MAC, is identified by price bars that close between the upper and lower bands, and are colored yellow.
The Bollinger Bands have been added to the Bulls ‘n Bears to integrate the advanced capabilities of the Bulls ‘n Bears with the Bollinger Bands. By doing so, we now have the ability to throw buy/sell signals, using a combination of the Bulls ‘n Bears red/yellow/green light system to the Bollinger Bands.
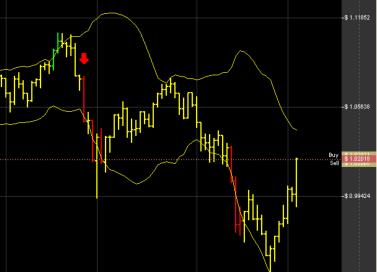
Here are the rules:
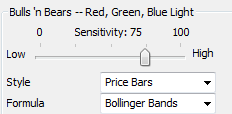 A buy signal is generated when a price bar closes above the upper Bollinger Band. That bar, along with any subsequent bar that closes above the upper Bollinger Band, is colored green.
A sell signal is generated when a price bar closes below the lower Bollinger Band. That bar, along with any subsequent bar that closes below the upper Bollinger Band, is colored red.
A neutral market, according to the Bollinger Bands, is identified by price bars that close between the upper and lower bands. These bars are colored yellow.
The Keltner Bands have been added to the Bulls ‘n Bears to integrate the advanced capabilities of the Bulls ‘n Bears with the Keltner Bands. By doing so, we now have the ability to throw buy/sell signals, using a combination of the Bulls ‘n Bears red/yellow/green light system to the Keltner Bands.
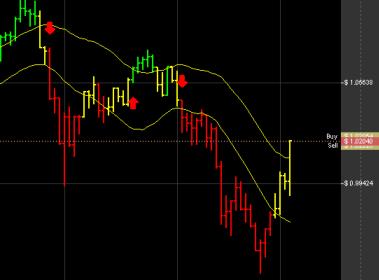
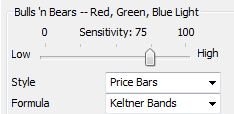 A buy signal is generated when a price bar closes above the upper Keltner Band, also, that bar, along with any subsequent bar that closes above the upper Keltner Band is colored green.
A sell signal is generated when a price bar closes below the lower Keltner Band, and, that bar, along with any subsequent bar that closes below the upper Keltner Band is colored red.
A neutral market, according to the Keltner Band, is identified by price bars that close between the upper and lower bands, and are colored yellow.
The proprietary Advantage Lines, included in the Bulls 'n Bears Trading System plugin, have been developed to help eliminate whipsaw versus a typical short-term moving average trading system. The main advantage of a typical short-term moving average trading system is that it provides early entry signals to potential trading opportunities and trend reversals. This is also the disadvantage of the system, as it can have whipsaw or a "head fake". Advantage lines were engineered to give the best of both worlds - early entry signals and avoidance of whipsaw.
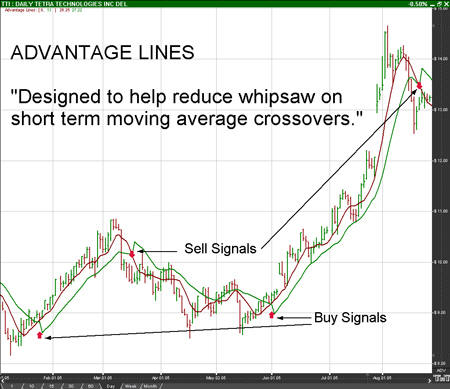
Signals:
Buy and sell arrows are thrown when the lines cross. In the example above, a buy arrow is thrown when the red line (Line 1) crosses above the green line (Line 2). A sell arrow is thrown if the opposite happens.
Open the Preference tab from the Control Panel on the right of your screen. Right-click on the chart, choose Chart Overlay Preferences, then Advantage Lines. You can also click on the Quick Link in the lower right "ADV". The Advantage Lines preferences will appear in the Control Panel. (Once you click on the chart, the Preference tab will go back to chart settings.)
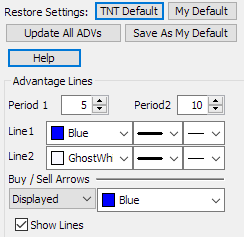 Restore Settings: TNT Default will change your settings back to the original software settings. My Default will change current settings to your personalized default settings. Apply To All ADVs will apply your selected settings on all open charts. Save As My Default will save your current personal settings.
Period 1 and Period 2: Change the period value by which each line is calculated here.
Line 1 and Line 2: Change the color, style, and thickness of the Indicator lines.
Buy/Sell Arrows: Turns the display for buy/sell arrows on or off. You also have the option to change the color of the buy/sell arrows.
Show Lines: The lines are on by default. However, the lines can be turned off to only show the arrows.
The Ribbon Indicator is a series of exponential moving averages lines used to identify trends. By placing 8 moving averages calculated with differing time periods onto the same chart, we can see the relative strength of a market trend. The indicator is very useful in highlighting and confirming trend changes with the Bulls ‘n Bears Trading System.
Convergence and Divergence
The most important signals are taken from the spacing between the Ribbon lines in each group, not from crossovers. When shorter-term lines (yellow) and longer-term lines (red) within a group are parallel and close together, the group is largely in agreement. When the Ribbon lines widen apart, this signals divergent views within the group. When Ribbon lines converge, this is a sign that the group view is changing.
Trend Strength: Parallel long-term Ribbon lines signal long-term investor support and a strong trend, and short-term Ribbon lines tend to bounce off the long-term Ribbon lines group.
Trend Weakness: Both groups of Ribbon lines converge and fluctuate more than usual.
Trend Start: A change in price direction accompanied by expanding Ribbon lines in both groups.
Short-Term Reversals: The short-term group crossover, diverge and then again converge; while the long-term group remains parallel.
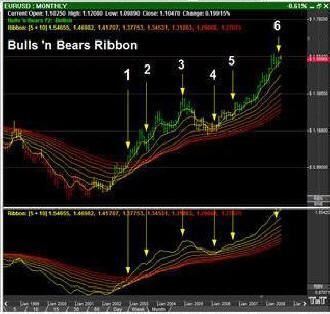
1. Short-term retracement gives an entry long signal
2. Another short-term retracement
3. Moving averages diverge, increasing the risk of a reversal
4. Strong retracement indicated changing short and medium-term views, but long-term view holds firm
5. Short-term retracement signals recovery
6. Moving averages diverge, warning of another reversal
The Ribbon Indicator is unique in Track 'n Trade because it can be viewed both in the indicator window or as a chart overlay.
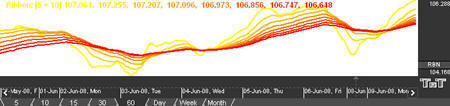
Open the Preferences Tab in your Control Panel. Select the RBN quick link at the right of the indicator window. (Once you click on the chart, the Preference tab will go back to chart settings.)
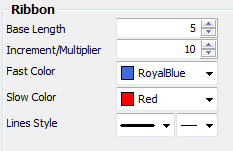 Restore Settings: TNT Default will change your settings back to the original software settings. My Default will change current settings to your personalized default settings. Apply To All Charts will apply your selected settings on all open charts. Save As My Default will save your current personal settings.
Base Length: Specify the period of the first and "fastest" moving average.
Increment/Multiplier: Specify the number by which the 7 additional moving averages periods will be incrementally calculated. This value will be added to the Base Length.
Fast Color: Specify the color of the fastest moving average line.
Slow Color: Specify the color of the slowest moving average line.
Lines Style: Choose the line style and thickness of your indicator line.
The Ribbon Overlay Indicator functions by the same principles as the Ribbon Indicator, but it is displayed as an overlay in the chart window.
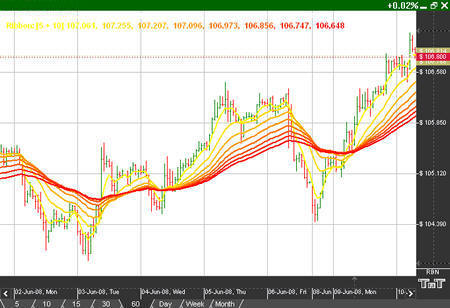
Right-click anywhere on the chart and go to “Overlay Properties.” Select Ribbon from the list. The preferences will appear in the Control Panel. (Once you click on the chart, the Preference tab will go back to chart settings.)
Restore Settings: TNT Default will change your settings back to the original software settings. My Default will change current settings to your personalized default settings. Apply To All Charts will apply your selected settings on all open charts. Save As My Default will save your current personal settings.
Base Length: Specify the period of the first and "fastest" moving average.
Increment/Multiplier: Specify the number by which the 7 additional moving averages periods will be incrementally calculated. This value will be added to the Base Length.
Fast Color: Specify the color of the fastest moving average line.
Slow Color: Specify the color of the slowest moving average line.
Lines Style: Choose the line style and thickness of your indicator
line.
 Japanese Candlesticks have long been a standard tool used by Japanese rice traders for centuries. Popularized in the Western world for trading Stocks, Futures, & Forex, Japanese Candlesticks have become a staple indicator of almost every trader.
Track ‘n Trade’s unique method of automatically identifying, cataloging, and signaling buy and sell signals derived from various candlestick formations is unique in the fact that Track ‘n Trade gives the trader the ability to filter out, or ‘decide’, what a true candlestick must match prior to receiving a signal.
Within Track ‘n Trade, you also have the ability to use external filters to help eliminate unwanted or overly aggressive signals allowing for a high level of signal purification.
Turning on Candlestick Auto-Recognition is like turning on an overlay. Simply right-click, go to Chart Overlays, and select Candlestick Auto-Recognition.
Example of Candlestick Auto-Recognition
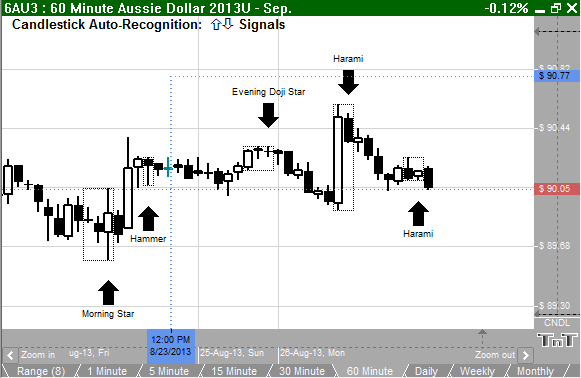
Preferences
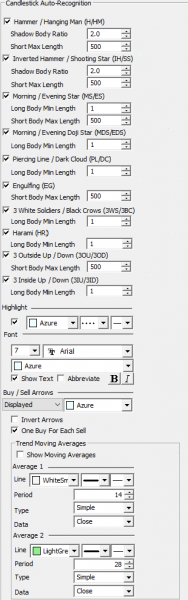 To open the Candlestick Auto-Recognition Preferences, click on the Quick Link (CNDL) in the lower right of the chart. Alternatively, you can right-click, select Overlay Properties and then Candlestick Auto-Recognition. If you click on the chart, the Preferences tab will go back to chart settings.
The Candlestick Auto-Recognition Indicator is able to recognize a long list of patterns. Descriptions and picture examples of each are listed below in the Candlestick Pattern Examples.
The Patterns: All of the features in the patterns settings can be simplified by breaking it down into a few concepts of enabling, lengths/ratios, and the Q-Calc button.
To enable or disable a pattern, simply check or uncheck its checkbox.
All lengths are measured in minimum moves (ticks or pips). All ratios are measured in multiples of their associated length, so 2.0 is two times as long as the length.
Highlight: The highlight controls the box that can optionally be drawn around the candlestick pattern. This box indicates a found pattern.
Font: Controls the font and color of on-screen patterns. You may show/hide text or abbreviate the candlestick pattern description.
Buy/Sell Arrows: Controls the display of the arrows.
Invert Arrows: Will reverse all signals received.
One Buy For Each Sell: Will only create one buy or sell signal per trend based on overall Trend Moving Averages settings.
The Trend Moving Averages: Used by the One Buy For Each Sell filter to limit the candlestick patterns discovered and displayed so that we don't have multiple same-side signals in a row. Trend direction determined by two configurable moving averages. Select Show Moving Averages to display these within the chart window.
More information about moving averages are available within the Chart Overlays Moving Averages section. [4]
White / Light Candlestick refers to a candlestick which closed at a higher price than it opened.
Black / Dark Candlestick refers to a candlestick which closed at a lower price than it opened.
 |
Hanging Man A black or a white
candlestick that consists of a small body near the high with a little or no upper shadow and a long lower tail. The lower tail should be two or three times the height of the body. Considered a
bearish pattern during an uptrend.
|
 |
Hammer A black or a white candlestick that consists of a small body near the high with a little or no upper shadow and a long lower tail. Considered a bullish pattern during a downtrend. |
 |
Inverted Black Hammer A black body
in an upside-down hammer position. Usually considered a bottom reversal signal.
|
 |
Inverted Hammer A black or a white candlestick in an upside-down hammer position. |
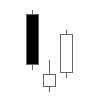 |
Morning Star Consists of a large black body candlestick followed by a small body (black or white) that occurred below the large black body candlestick. On the following day, a third white body candlestick is formed that closed well into the black body candlestick.
It is considered as a major reversal signal when it appears at the bottom.
|
 |
Evening Star Consists of a large white body candlestick followed by a small body candlestick (black or white) that gaps above the previous. The third is a black body candlestick that closes well within the large white body. It is considered as a reversal signal when it appears at the top level. |
 |
Morning Doji Star Consists of a large black body candlestick followed by a Doji that occurred below the preceding candlestick. On the following day, a third white body candlestick is formed that closed well into the black body candlestick which appeared before the Doji. It is considered as a major reversal signal that is more bullish than the regular morning star pattern because of the existence of the Doji. |
 |
Evening Doji Star Consists of three candlesticks. First is a large white body candlestick followed by a Doji that gap above the white body. The third candlestick is a black body that closes well into the white body. When it appears at the top it is considered as a reversal signal. It signals more bearish trend than the evening star pattern because of the doji that has appeared between the two bodies. |
 |
Piercing Line Consists of a black candlestick followed by a white candlestick that opens lower than the low of preceding but closes more than halfway into black body candlestick. It is considered as reversal signal when it appears at the bottom. |
 |
Dark Cloud Cover Consists of a long white candlestick followed by a black candlestick that opens above the high of the white candlestick and closes well into the body of the white candlestick. It is considered as a bearish reversal signal during an uptrend. |
 |
Engulfing Bearish Line Consists of a small white body that is contained within the followed large black candlestick. When it appears at the top it is considered as a major reversal signal. |
 |
Engulfing Bullish Line Consists of a small black body that is contained within the followed large white candlestick. When it appears at the bottom it is interpreted as a major reversal signal. |
 |
Three White Soldiers Consists of three long white candlesticks with consecutively higher closes. The closing prices are near to or at their highs. When it appears at the bottom it is interpreted as a bottom reversal signal. |
 |
Three Black Crows Consists of three long black candlesticks with consecutively lower closes. The closing prices are near to or at their lows. When it appears at the top it is considered as a top reversal signal. |
 |
Bullish Harami Consists of an unusually large black body followed by a small white body (contained within a large black body). It is considered as a bullish pattern when preceded by a downtrend. |
 |
Bearish Harami Consists of an unusually large white body followed by a small black body (contained within a large white body). It is considered as a bearish pattern when preceded by an uptrend. |
 |
3 Outside Up Consists of a black candlestick followed by a large body white candlestick with its high and low engulfing the previous bar. It is considered as a bullish pattern when the third candle closes higher. |
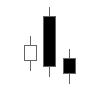 |
3 Outside Down Consists of a white candlestick followed by a large body black candlestick with its high and low engulfing the previous bar. It is considered as a bearish pattern when the third candle closes lower. |
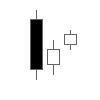 |
3 Inside Up Consists of a large body black candlestick followed by a small body white candlestick which is engulfed within the high and low of the previous candlestick. It is considered as a bullish pattern when the third candle closes higher. |
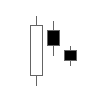 |
3 Inside Down Consists of a large body white candlestick followed by a small body black candlestick which is engulfed within the high and low of the previous candlestick. It is considered as a bearish pattern when the third candle closes lower. |
End User License Agreement (EULA)
END-USER LICENSE AGREEMENT FOR TRACK 'N TRADE by GECKO SOFTWARE
IMPORTANT-READ CAREFULLY: This Gecko Software End-User License Agreement ("EULA") is a legal agreement between you (either an individual or a single entity) and Gecko Software Corporation for the Gecko Software product identified above, which includes computer software and may include associated media, printed materials, and "online" or electronic documentation and data ("SOFTWARE PRODUCT"). The SOFTWARE PRODUCT also includes any updates and supplements to the original SOFTWARE PRODUCT provided to you by Gecko Software. Any software provided along with the SOFTWARE PRODUCT that is associated with a separate end-user license agreement is licensed to you under the terms of that license agreement. By installing, copying, downloading, accessing or otherwise using the SOFTWARE PRODUCT, you agree to be bound by the terms of this EULA. If you do not agree to the terms of this EULA, do not continue to install or use the SOFTWARE PRODUCT. No verbal or written agreement may supersede this agreement.
SOFTWARE PRODUCT LICENSE
The SOFTWARE PRODUCT is protected by copyright laws and international copyright treaties, as well as other intellectual property laws and treaties. The SOFTWARE PRODUCT is licensed, not sold.
GRANT OF LICENSE. This EULA grants you the following rights: You may install as many copies of Track ‘n Trade on up to three of your personally used computers (i.e. home, work, and laptop). Track ‘n Trade requires a login and password to gain access, you are not allowed to share your login and password with anyone else whosoever; in so doing, you will be in violation of this agreement. You may not allow remotely connected COMPUTERS, nor to invoke application sharing of the software. This connection includes any indirect connections made through software or hardware which pools or aggregates connections. This license agreement allows you to personally use the software while at home, work or on the road; this is not the right to lend out copies of this software to your friends and family. Even though you are allowed to install the SOFTWARE on multiple personally used workstations, the SOFTWARE can only be executed and running on one COMPUTER at a time; no simultaneous use is allowed without the purchase of additional licenses. (Simultaneous Logging in from any other computer will automatically “kick off” any other active user logged in and using that same login and password. The person who is logged into the system has complete access to all account information, it is the user’s responsibility to keep their login and password secure, Gecko Software will not be liable for loss due to lost or stolen login information, Gecko Software recommends users use highly cryptic login and password information. If you feel your login and password information has been compromised, contact Gecko Software immediately. )
License Pak. If this package is a Gecko Software License Pak, you may install and use additional copies of the computer software portion of the SOFTWARE PRODUCT up to the number of copies specified above as "Licensed Copies".
DESCRIPTION OF OTHER RIGHTS AND LIMITATIONS. Academic Edition Software. If the SOFTWARE PRODUCT is identified as "Academic Edition" or "AE," you must be a "Qualified Educational User" to use the SOFTWARE PRODUCT. If you are not a Qualified Education User, you have no rights under this EULA. To determine if you are a Qualified Educational User, please contact the Gecko Software Sales Information Center in the USA at 435-752-8026 ext. 2.
Not For Resale Software. If the SOFTWARE PRODUCT is labeled "Not For Resale" or "NFR," then, notwithstanding other sections of this EULA, your use of the SOFTWARE PRODUCT is limited to use for demonstration, test, or evaluation purposes and you may not resell, or otherwise transfer for value, or install the SOFTWARE PRODUCT on more than one single COMPUTER.
Limitations on Reverse Engineering, Decompilation, and Disassembly. You may not reverse engineer, decompile, or disassemble the SOFTWARE PRODUCT, except and only to the extent that such activity is expressly permitted by applicable law notwithstanding this limitation.
Separation of Components. The SOFTWARE PRODUCT is licensed as a single product. Its component parts may not be separated.
Rental. You may not rent, lease or lend the SOFTWARE PRODUCT.
Trademarks. This EULA does not grant you any rights in connection with any trademarks or service marks of Gecko Software.
Support Services. Gecko Software may provide you with support services related to the SOFTWARE PRODUCT ("Support Services"). Use of Support Services is governed by the Gecko Software policies and programs described in the user manual, in "on line" documentation and/or other Gecko Software provided materials. Any supplemental software code provided to you as part of the Support Services shall be considered part of the SOFTWARE PRODUCT and subject to the terms and conditions of this EULA. With respect to technical information you provide to Gecko Software as part of the Support Services, Gecko Software may use such information for its business purposes, including for product support and development.
Software Transfer. The user of the SOFTWARE PRODUCT may make a one-time permanent transfer of this EULA and SOFTWARE PRODUCT only directly to an end user. This transfer must include all of the SOFTWARE PRODUCT (including all component parts, the media and printed materials, any upgrades, this EULA, and, if applicable, the Certificate of Authenticity). Such transfer may not be by way of consignment or any other indirect transfer. The transferee of such one-time transfer must agree to comply with the terms of this EULA. Both parties must contact Gecko Software to make the transfer complete.
Even though we have given the right to transfer the software application license, we do not give the right to transfer data subscription services. Data subscription services are non-transferable.
Termination. Gecko Software may terminate your license and this EULA at any time for any reason what so ever; without the obligation of reimbursement or compensation. Therefore, if you fail to comply with the terms of use set forth in this agreement, or if Gecko Software gives notice of termination of your license, you must immediately destroy all copies of the SOFTWARE PRODUCT and all of its component parts.
UPGRADES. If the SOFTWARE PRODUCT is labeled as an upgrade, you must be properly licensed to use a product identified by Gecko Software as being eligible for the upgrade in order to use the SOFTWARE PRODUCT. A SOFTWARE PRODUCT labeled as an upgrade replaces and/or supplements the product that formed the basis for your eligibility for the upgrade. You may use the resulting upgraded product only in accordance with the terms of this EULA.
COPYRIGHT. All title and intellectual property rights in and to the SOFTWARE PRODUCT (including but not limited to any images, photographs, animations, video, audio, music, text, and "applets" incorporated into the SOFTWARE PRODUCT), the accompanying printed materials, and any copies of the SOFTWARE PRODUCT are owned by Gecko Software or its suppliers. All title and intellectual property rights in and to the content which may be accessed through use of the SOFTWARE PRODUCT is the property of the respective content owner and may be protected by applicable copyright or other intellectual property laws and treaties. This EULA grants you no rights to use such content. All rights not expressly granted are reserved by Gecko Software.
DUAL-MEDIA SOFTWARE. You may receive the SOFTWARE PRODUCT AND/OR Educational materials in more than one medium. Regardless of the type or size of medium you receive, you may use only one medium that is appropriate for your computer. You may not loan, rent, lease, lend or otherwise transfer the other medium to another user, except as part of the permanent transfer (as provided above) of the SOFTWARE PRODUCT.
BACKUP COPY. Except as expressly provided in this EULA, you may not otherwise make copies of the SOFTWARE PRODUCT, EDUCATIONAL LITERATURE, OR MULTIMEDIA PRODUCTS or any materials accompanying the SOFTWARE PRODUCT.
U.S. GOVERNMENT RESTRICTED RIGHTS. All SOFTWARE PRODUCTS provided to the U.S. Government pursuant to solicitations issued on or after December 1, 1995 is provided with the commercial license rights and restrictions described elsewhere herein. All SOFTWARE PRODUCT provided to the U. S. Government pursuant to solicitations issued prior to December 1, 1995 is provided with "Restricted Rights" as provided for in FAR, 48 CFR 52.227-14 (JUNE 1987) or DFAR, 48 CFR 252.227-7013 (OCT 1988), as applicable.
EXPORT RESTRICTIONS. You agree that you will not export or re-export the SOFTWARE PRODUCT, any part thereof, or any process or service that is the direct product of the SOFTWARE PRODUCT (the foregoing collectively referred to as the "Restricted Components"), to any country, person or entity subject to U.S. export restrictions. You specifically agree not to export or re-export any of the Restricted Components: (i) to any country to which the U.S. has embargoed or restricted the export of goods or services, which currently include, but are not necessarily limited to Cuba, Iran, Iraq, Libya, North Korea, Sudan and Syria, or to any national of any such country, wherever located, who intends to transmit or transport the Restricted Components back to such country; (ii) to any person or entity who you know or have reason to know will utilize the Restricted Components in the design, development or production of nuclear, chemical or biological weapons; or (iii) to any person or entity who has been prohibited from participating in U.S. export transactions by any federal agency of the U.S. government. You warrant and represent that neither the BXA nor any other U.S. federal agency has suspended, revoked or denied your export privileges.
MISCELLANEOUS. This EULA, and all matters relating thereto, including any matter or dispute arising regarding this EULA, shall be interpreted, governed, and enforced according to the laws of the State of Utah excluding the application of its conflicts of law rules, and any user of this software by accepting this EULA hereto consents to the jurisdiction of the First District Court of Utah for Cache County to resolve such disputes. Should you have any questions concerning this EULA, or if you desire to contact Gecko Software for any reason, please contact by email at gecko@geckosoftware.com [5]
LIMITED WARRANTY. Gecko Software provides a full 14 days to try the Track 'n Trade software, plug-ins, and data services before ever needing to make any kind of purchasing decision. This allows you the added security and benefit of having a try-before-you-buy satisfaction guarantee; therefore, no returns are available after purchase of these items.
Gecko Software does not guarantee that any mathematical formulas are correct, or that any data is correct, or that any of the rules used to create the software to simulate real-life situations are correct. These are just Gecko Software's best efforts, and you as the licensee of the software agree not to hold Gecko Software liable for any mistakes, discrepancies, inaccuracies or mathematical errors that may be included with the software application, supporting materials, manuals, or supplemental products provided by Gecko Software or its subsidiaries, employees, managers, directors, associates, affiliates, or otherwise related individuals or entities. You agree to use this software totally and 100% at your own risk.
You must also agree to and recognize that the list of support technologies, provided by numerous companies, is long and the ability to bring all these capabilities together in a workable solution is magic at best, and the user recognizes that any failure of any of these technologies along the way could cause any part of or all of this program and associated features to fail, and agrees to hold Gecko Software and all associated companies harmless in all respects.
If an implied warranty or condition is created by your state/jurisdiction and federal or state/provincial law prohibits disclaimer of it, you also have an implied warranty or condition, BUT ONLY AS TO DEFECTS DISCOVERED DURING THE PERIOD OF THIS LIMITED WARRANTY free trial period. AS TO ANY DEFECTS DISCOVERED AFTER THE FREE 14 DAY TRIAL PERIOD, THERE IS NO WARRANTY OR CONDITION OF ANY KIND. Some states/jurisdictions do not allow limitations on duration of an implied warranty, so the above limitation may not apply to you. Any supplements or updates to the SOFTWARE PRODUCT, including without limitation, any (if any) service pack or hot fixes provided to you after the risk-free Limited Warranty period are not covered by any warranty or condition, express or implied.
LIMITATION ON REMEDIES. NO CONSEQUENTIAL OR OTHER DAMAGES Your exclusive remedy for any breach of this Limited Warranty is as set forth below. YOU ARE NOT ENTITLED TO ANY DAMAGES, INCLUDING BUT NOT LIMITED TO CONSEQUENTIAL DAMAGES, to the maximum extent allowed by applicable law, even if any remedy fails of its essential purpose. The terms "Exclusion of Incidental, Consequential and Certain Other Damages" below are also incorporated into this Limited Warranty. Some states/jurisdictions do not allow the exclusion or limitation of incidental or consequential damages, so the above limitation or exclusion may not apply to you.
YOUR EXCLUSIVE REMEDY. Gecko Software and its suppliers' entire liability and your exclusive remedy shall be, at Gecko Software's sole discretion, repair or replacement of, the SOFTWARE PRODUCT. This Limited Warranty is void if a failure of the SOFTWARE PRODUCT has resulted from accident, abuse, misapplication, abnormal use a virus or as an act of god as defined by the laws of the state of Utah. Any replacement SOFTWARE PRODUCT will be warranted for the remainder of the original warranty period. Outside the United States, neither these remedies nor any product support services offered by Gecko Software are available without proof of purchase from an authorized source. To exercise your remedy, contact Gecko Software at the email address specified above.
DISCLAIMER OF WARRANTIES. The limited warranty that appears above is the only express warranty made to you and is provided in lieu of any other express warranties (if any) created by any documentation, packaging, or outside reseller advertisements or claims. Except for the limited warranty and to the maximum extent permitted by applicable law, Gecko Software and its suppliers provide the SOFTWARE PRODUCT and Support Services (if any) AS IS AND WITH ALL FAULTS, and hereby disclaim all other warranties and conditions, either express, implied or statutory, including, but not limited to, any (if any) implied warranties or conditions of merchantability, of fitness for a particular purpose, of lack of viruses, of accuracy or completeness of responses, of results, and of lack of negligence or lack of workmanlike effort, all with regard to the SOFTWARE PRODUCT, and the provision of or failure to provide Support Services. ALSO, THERE IS NO WARRANTY OR CONDITION OF TITLE, QUIET ENJOYMENT, QUIET POSSESSION, AND CORRESPONDENCE TO DESCRIPTION OR NON-INFRINGEMENT WITH REGARD TO THE SOFTWARE PRODUCT.
EXCLUSION OF INCIDENTAL, CONSEQUENTIAL AND CERTAIN OTHER DAMAGES. To the maximum extent permitted by applicable law, in no event shall Gecko Software or its suppliers be liable for any special, incidental, indirect, or consequential damages whatsoever (including, but not limited to, damages for loss of profits or confidential or other information, for business interruption, for personal injury, for loss of privacy, for failure to meet any duty including of good faith or of reasonable care, for negligence, and for any other pecuniary or other loss whatsoever) arising out of or in any way related to the use of or inability to use the SOFTWARE PRODUCT, the provision of or failure to provide Support Services, or otherwise under or in connection with any provision of this EULA, even in the event of the fault, tort (including negligence), strict liability, breach of contract or breach of warranty of Gecko Software or any supplier, and even if Gecko Software or any supplier has been advised of the possibility of such damages.
Gecko Software at its discretion may, from time to time, contact you by telephone, email, paper mail, express mail, etc. By agreeing to this EULA and installing this software, you are giving digitally written consent to receive telephone calls and/or emails from Gecko Software, its affiliates, and associated vendors, and you wave your rights to any laws prohibiting Gecko Software from contacting you via telephone, email, or any other method preferred by Gecko Software.
DATA DOWNLOAD/DATA SERVICE. IS DEFINED AS: This is a non-guaranteed service, with no rights or privileges whatsoever, and is only an extension of the service provided by Track 'n Trade, and Gecko Software, Inc. not a standard feature.
SUBSCRIPTION BASED DATA DOWNLOAD. IS DEFINED AS: Data in which Gecko Software provides by computer transmission services to their subscribing customers. This service is not a guaranteed service, and may be discontinued, offline, or late for any given period or amount of time without warranty or restitution. Data subscription services and fees are a non-refundable, non-guaranteed extension of service provided by Gecko Software.
Data has been provided from sources believed to be reliable but no guarantee is made as to its accuracy, when trading "real" markets, consult a licensed brokerage firm to confirm ALL price action. This license does not give any recipient the right to re-transmit or re-distribute this data in any format whatsoever.
LIMITATION OF LIABILITY AND REMEDIES. Notwithstanding any damages that you might incur for any reason whatsoever (including, without limitation, all damages referenced above and all direct or general damages), the entire liability of Gecko Software and any of its suppliers under any provision of this EULA and your exclusive remedy for all of the foregoing (except for any remedy of repair or replacement elected by Gecko Software with respect to any breach of the Limited Warranty) shall be limited to the amount actually paid by you for the SOFTWARE PRODUCT. The foregoing limitations, exclusions, and disclaimers described above shall apply to the maximum extent permitted by applicable law, even if any remedy fails its essential purpose.
High-Risk Investments
Trading Stocks, Futures, Foreign Exchange (Forex), or Options on margin carries a high level of risk, and may not be suitable for all investors. The high degree of leverage can work against you as well as for you. Before deciding to trade any of these markets you should carefully consider your investment objectives, level of experience, and risk appetite. The possibility exists that you could sustain a loss of some or all of your initial investment and therefore you should not invest money that you cannot afford to lose. You should be aware of all the risks associated with trading these markets, and seek advice from an independent financial advisor if you have any doubts.
Internet Trading Risks
There are risks associated with utilizing an Internet-based deal execution trading system including, but not limited to, the failure of hardware, software, and Internet connection. Since Gecko Software and any partners do not control signal power, its reception or routing via Internet, the configuration of your equipment or reliability of its connection, we cannot be responsible for communication failures, distortions or delays when trading via the Internet. Our partners, employ backup systems and contingency plans to minimize the possibility of system failure, and trading via telephone to the clearing firm is an additional option if such an event occurs.
Accuracy of Information
The content on any Gecko Software website or in any manual is subject to change at any time without notice and is provided for the sole purpose of assisting traders to make independent investment decisions. Gecko Software has taken reasonable measures to ensure the accuracy of the information it provides, however, does not guarantee its accuracy, and will not accept liability for any loss or damage which may arise directly or indirectly from the content or your inability to access such content, for any delay in or failure of the transmission or the receipt of any instruction or notifications posted or sent.
Distribution
This software is not intended for distribution, or use by, any person in any country where such distribution or use would be contrary to local law or regulation. None of the software or services referred to in this EULA are available to persons residing in any country where the provision of such software or services would be contrary to local law or regulation or to the laws of the United States. It is your responsibility to ascertain whether the terms comply with any local law or regulation to which they are subject.
Market Risks and Online Trading
The trading program(s) provide sophisticated order entry and tracking of orders. All stop-loss, limit and entry orders are generally deemed reliable against slippage, but slippage may still occur based on market conditions and liquidity. Trading on-line, no matter how convenient or efficient does not necessarily reduce risks associated with stocks, futures, forex, or options trading. All quotes and trades are subject to the terms and conditions of the End-User License Agreement and Client Agreement.
Testimonial Disclaimer
Unique experiences and past performances are not necessarily indicative of future results! Testimonials herein are unsolicited and are non-representative of all clients; certain accounts may have worse performance than that indicated. Trading Stocks, Futures, Forex, or Options involves substantial risk and there is always the potential for loss. Your trading results may vary. Because the risk factor is high trading any leverage markets, only genuine “risk” funds should be used in such trading. If you do not have the extra capital that you can afford to lose, you should not trade. No completely “safe” trading system has ever been devised, and no one can guarantee profits or freedom from loss. Gecko Software does not pay for testimonials, most of our testimonials are unsolicited and voluntary.
Gecko Software Market Opinions
Any opinions, news, research, analyses, prices, or other information contained on any Gecko Software website are provided as general market commentary and do not constitute investment advice. Gecko Software is not liable for any loss or damage, including without limitation, any loss of profit, which may arise directly or indirectly from use of or reliance on such information. Gecko Software has taken reasonable measures to ensure the accuracy of the information on any of its websites or manuals. The content is subject to change at any time without notice.
Views, Opinions, and outside links
The views and opinions represented in any link to an outside website link and/or resources are not controlled by Gecko Software or by our associated firms. Further, Gecko Software nor our associated firms are responsible for their availability, content, or delivery of services.
DISCLAIMER: THE DATA CONTAINED HEREIN IS BELIEVED TO BE RELIABLE BUT CANNOT BE GUARANTEED AS TO RELIABILITY, ACCURACY, OR COMPLETENESS; AND, AS SUCH ARE SUBJECT TO CHANGE WITHOUT NOTICE. WE WILL NOT BE RESPONSIBLE FOR ANYTHING, WHICH MAY RESULT FROM RELIANCE ON THIS DATA OR THE OPINIONS EXPRESSED HEREIN.
DISCLOSURE OF RISK: THE RISK OF LOSS IN TRADING STOCKS, FUTURES, FOREX, AND OPTIONS CAN BE SUBSTANTIAL; THEREFORE, ONLY GENUINE RISK FUNDS SHOULD BE USED. STOCKS, FUTURES, FOREX, AND OPTIONS MAY NOT BE SUITABLE INVESTMENTS FOR ALL INDIVIDUALS, AND INDIVIDUALS SHOULD CAREFULLY CONSIDER THEIR FINANCIAL CONDITION IN DECIDING WHETHER TO TRADE. OPTION TRADERS SHOULD BE AWARE THAT THE EXERCISE OF A LONG OPTION WOULD RESULT IN A FUTURES OR FOREX POSITION.
HYPOTHETICAL PERFORMANCE RESULTS HAVE MANY INHERENT LIMITATIONS, SOME OF WHICH ARE DESCRIBED BELOW.
NO REPRESENTATION IS BEING MADE THAT ANY ACCOUNT WILL, OR IS LIKELY TO, ACHIEVE PROFITS OR LOSSES SIMILAR TO THOSE SHOWN. IN FACT, THERE ARE FREQUENTLY SHARP DIFFERENCES BETWEEN HYPOTHETICAL PERFORMANCE RESULTS AND THE ACTUAL RESULTS SUBSEQUENTLY ACHIEVED BY ANY PARTICULAR TRADING PROGRAM.
ONE OF THE LIMITATIONS OF HYPOTHETICAL PERFORMANCE RESULTS IS THAT THEY ARE GENERALLY PREPARED WITH THE BENEFIT OF HINDSIGHT. IN ADDITION, HYPOTHETICAL TRADING DOES NOT INVOLVE FINANCIAL RISK, AND NO HYPOTHETICAL TRADING RECORD CAN COMPLETELY ACCOUNT FOR THE IMPACT OF FINANCIAL RISK IN ACTUAL TRADING. FOR EXAMPLE, THE ABILITY TO WITHSTAND LOSSES OR TO ADHERE TO A PARTICULAR TRADING PROGRAM, IN SPITE OF TRADING LOSSES, ARE MATERIAL POINTS WHICH CAN ALSO ADVERSELY AFFECT ACTUAL TRADING RESULTS. THERE ARE NUMEROUS OTHER FACTORS RELATED TO THE MARKETS, IN GENERAL, OR TO THE IMPLEMENTATION OF ANY SPECIFIC TRADING PROGRAM WHICH CANNOT BE FULLY ACCOUNTED FOR IN THE PREPARATION OF HYPOTHETICAL PERFORMANCE RESULTS AND ALL OF WHICH CAN ADVERSELY AFFECT ACTUAL TRADING RESULTS.
Gecko Software Risk Disclosure
Risk Warning
High-Risk Investments
Trading Stocks, Futures, Foreign Exchange (Forex), or Options on margin carries a high level of risk, and may not be suitable for all investors. The high degree of leverage can work against you as well as for you. Before deciding to trade any of these markets you should carefully consider your investment objectives, level of experience, and risk appetite. Risk capital is money that can be lost without jeopardizing one's financial security or lifestyle. Only risk capital should be used for trading and only those with sufficient risk capital should consider trading. The possibility exists that you could sustain losses exceeding your initial investment. You should be aware of all the risks associated with trading these markets, and seek advice from an independent financial advisor if you have any doubts.
Internet Trading Risks
There are risks associated with utilizing an Internet-based deal execution trading system including, but not limited to, the failure of hardware, software, and Internet connection. Since Gecko Software and any partners do not control signal power, its reception or routing via Internet, the configuration of your equipment or reliability of its connection, we cannot be responsible for communication failures, distortions or delays when trading via the Internet. Our partners, employ backup systems and contingency plans to minimize the possibility of system failure, and trading via telephone to the clearing firm is an additional option if such an event occurs.
Accuracy of Information
The content on this website/manual is subject to change at any time without notice and is provided for the sole purpose of assisting traders to make independent investment decisions. Gecko Software has taken reasonable measures to ensure the accuracy of the information on the website/manual, however, does not guarantee its accuracy, and will not accept liability for any loss or damage which may arise directly or indirectly from the content or your inability to access the website/manual, for any delay in or failure of the transmission or the receipt of any instruction or notifications sent through this website or by email.
Distribution
This site is not intended for distribution, or use by, any person in any country where such distribution or use would be contrary to local law or regulation. None of the services or investments referred to in this website/manual are available to persons residing in any country where the provision of such services or investments would be contrary to local law or regulation or to the laws of the United States. It is the responsibility of visitors to this website/manual to ascertain the terms of and comply with any local law or regulation to which they are subject.
Market Risks and Online Trading
The trading program(s) provide sophisticated order entry and tracking of orders. All stop-loss, limit and entry orders are generally deemed reliable against slippage, but slippage may still occur based on market conditions and liquidity. Trading on-line, no matter how convenient or efficient does not necessarily reduce risks associated with stocks, futures, forex, or options trading. All quotes and trades are subject to the terms and conditions of the End-User License Agreement and Client Agreement.
Testimonial Disclaimer
Unique experiences and past performances are not necessarily indicative of future results! Testimonials herein are unsolicited and are non-representative of all clients; certain accounts may have worse performance than that indicated. Trading Stocks, Futures, Forex, or Options involves substantial risk and there is always the potential for loss. Your trading results may vary. Because the risk factor is high trading any leverage markets, only genuine “risk” funds should be used in such trading. If you do not have the extra capital that you can afford to lose, you should not trade. No completely “safe” trading system has ever been devised, and no one can guarantee profits or freedom from loss. Gecko Software does not pay for testimonials, most of our testimonials are unsolicited and voluntary.
Gecko Software Market Opinions
Any opinions, news, research, analyses, prices, or other information contained on this website/manual are provided as general market commentary and do not constitute investment advice. Gecko Software is not liable for any loss or damage, including without limitation, any loss of profit, which may arise directly or indirectly from use of or reliance on such information. Gecko Software has taken reasonable measures to ensure the accuracy of the information on the website/manual. The content on this website/manual is subject to change at any time without notice.
Views, Opinions, and outside links
The views and opinions represented in any link to an outside website link and/or resources are not controlled by Gecko Software or by our associated firms. Further, Gecko Software nor our associated firms are responsible for their availability, content, or delivery of services.
DISCLAIMER: THE DATA CONTAINED HEREIN IS BELIEVED TO BE RELIABLE BUT CANNOT BE GUARANTEED AS TO RELIABILITY, ACCURACY, OR COMPLETENESS; AND, AS SUCH ARE SUBJECT TO CHANGE WITHOUT NOTICE. WE WILL NOT BE RESPONSIBLE FOR ANYTHING, WHICH MAY RESULT FROM RELIANCE ON THIS DATA OR THE OPINIONS EXPRESSED HEREIN.
DISCLOSURE OF RISK: THE RISK OF LOSS IN TRADING STOCKS, FUTURES, FOREX, AND OPTIONS CAN BE SUBSTANTIAL; THEREFORE, ONLY GENUINE RISK FUNDS SHOULD BE USED. STOCKS, FUTURES, FOREX, AND OPTIONS MAY NOT BE SUITABLE INVESTMENTS FOR ALL INDIVIDUALS, AND INDIVIDUALS SHOULD CAREFULLY CONSIDER THEIR FINANCIAL CONDITION IN DECIDING WHETHER TO TRADE. OPTION TRADERS SHOULD BE AWARE THAT THE EXERCISE OF A LONG OPTION WOULD RESULT IN A FUTURES OR FOREX POSITION.
HYPOTHETICAL PERFORMANCE RESULTS HAVE MANY INHERENT LIMITATIONS, SOME OF WHICH ARE DESCRIBED BELOW.
NO REPRESENTATION IS BEING MADE THAT ANY ACCOUNT WILL, OR IS LIKELY TO, ACHIEVE PROFITS OR LOSSES SIMILAR TO THOSE SHOWN. IN FACT, THERE ARE FREQUENTLY SHARP DIFFERENCES BETWEEN HYPOTHETICAL PERFORMANCE RESULTS AND THE ACTUAL RESULTS SUBSEQUENTLY ACHIEVED BY ANY PARTICULAR TRADING PROGRAM.
ONE OF THE LIMITATIONS OF HYPOTHETICAL PERFORMANCE RESULTS IS THAT THEY ARE GENERALLY PREPARED WITH THE BENEFIT OF HINDSIGHT. IN ADDITION, HYPOTHETICAL TRADING DOES NOT INVOLVE FINANCIAL RISK, AND NO HYPOTHETICAL TRADING RECORD CAN COMPLETELY ACCOUNT FOR THE IMPACT OF FINANCIAL RISK IN ACTUAL TRADING. FOR EXAMPLE, THE ABILITY TO WITHSTAND LOSSES OR TO ADHERE TO A PARTICULAR TRADING PROGRAM, IN SPITE OF TRADING LOSSES, ARE MATERIAL POINTS WHICH CAN ALSO ADVERSELY AFFECT ACTUAL TRADING RESULTS. THERE ARE NUMEROUS OTHER FACTORS RELATED TO THE MARKETS, IN GENERAL, OR TO THE IMPLEMENTATION OF ANY SPECIFIC TRADING PROGRAM WHICH CANNOT BE FULLY ACCOUNTED FOR IN THE PREPARATION OF HYPOTHETICAL PERFORMANCE RESULTS AND ALL OF WHICH CAN ADVERSELY AFFECT ACTUAL TRADING RESULTS.
Links
[1] https://secure.geckosoftware.com/account_manager/
[2] http://www.trackntrade.com
[3] http://www.geckosoftware.com
[4] http://education.trackntrade.com/node/1280/
[5] mailto:gecko@geckosoftware.com