The futures market provides a variety of trading opportunities. In addition to profiting from rising prices by purchasing futures options or from falling prices by selling futures contracts, there is an opportunity to profit from the relationship between different contracts, or spread. A spread refers to the simultaneous purchase and sale of two or more different futures contracts.
When establishing, or "putting on," a spread, a trader looks at the price differential of the spread rather than the absolute contract price levels. The contract that is viewed as "cheap" is purchased (a long position is established). The contract that is viewed as expensive, or "dear," is sold (a short position is established). If market prices move as expected, meaning the long position gains in value relative to the short position, the trader profits from the change in the relationship between the prices.
The concern for a spread trader is the change in the relationship between a long contract and a short one, not the absolute price level of the commodity in question. Of course, just because you are trading a spread does not guarantee or eliminate losses. If the long contract decreases in value relative to the short position, then the spread trader will incur losses.
The key to spread trading is in the relative performance of one futures contract to another. Though some spreads have a basic market bias, known as bull and bear spreads, the absolute price level of the underlying commodity contracts is not important, only the relative performance of one contract versus the other. In other words, a spread trade is a speculation that one contract will out perform another contract.
Available online: Introduction Video to the Spreads Plug-in. Visit us at: http://www.trackntrade.com/tour.htm [1] and select the Spreads video. To view this video you will need a copy of Microsoft's Media Player.
To open a spreads chart, select the Spreads tab in the Control Panel. Select the two futures contracts from the dropdown menu that you would like to use in generating a spreads chart. When you have made your selections, click the Open Chart button and the spreads chart will display.
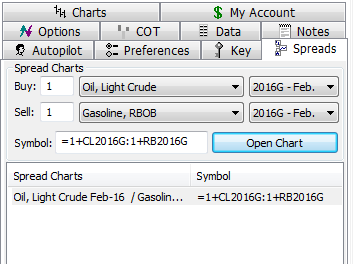
The spread will be listed in the Spread Chart list and the individual contracts will be listed in the Commodity tab. These spreads that you open will be part of your chartbook when you save and close it.
In the View menu, select Spread Margins and the Spread Margins window will open.
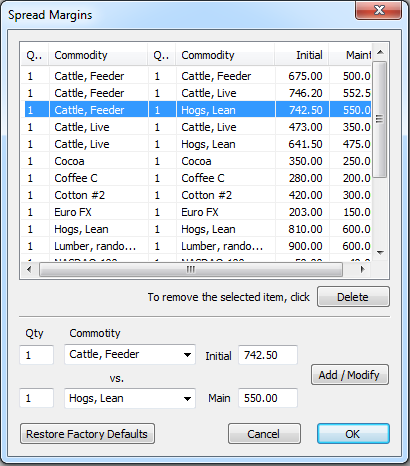
To modify a margin: Click on the margin in the list, make changes to the margins, and then select the "Add/Modify" button.
To add a new margin: Select the commodities for the spread and then type in the values for the Initial and Maintenance amounts and then click the "Add/Modify" button.
To restore factory defaults: To restore the margins to software defaults click on the "Restore factory defaults" button.
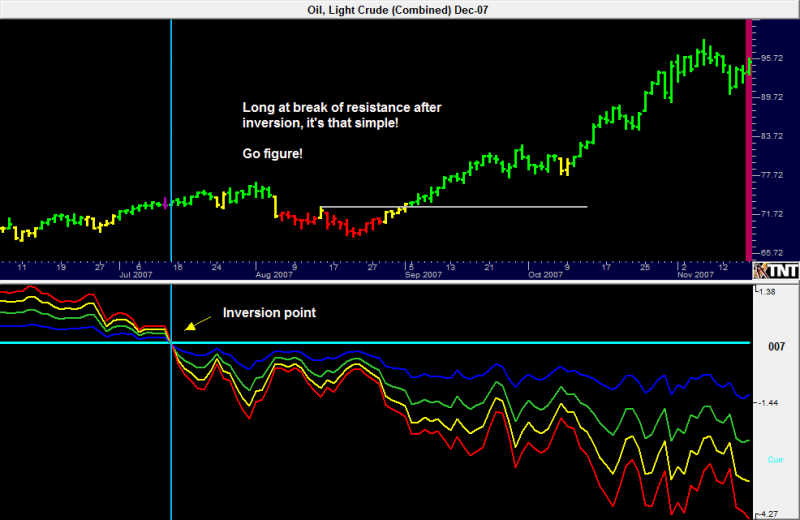
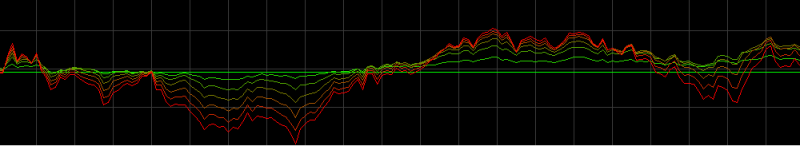
The Double 07 is an additional indicator included in the Spreads Plug-in. The premise behind the 007 indicator is to quickly visualize differences in the spread contract prices over the same commodity.
By charting the different contracts you are able to see “inversions points” (points where the future contracts cross over the front month contract). These inversions points can be used in combination with other indicators to help identify market entry points.
ACTIVATING 007
To turn on the 007 indicator the spreads plug-in must first be owned. To see if you own the spreads plug-in you can select the help option from the menu and select “About Track ‘n Trade” If the spreads plug-in is owned you will see “ON” next to spreads in the plug-in section. Turning 007 on can be done easily by right clicking on in the indicator window and selecting 007 (Double O7), or by selecting the 007 from the indicator selector at the bottom of the software window. (Figure 1)
Figure 1
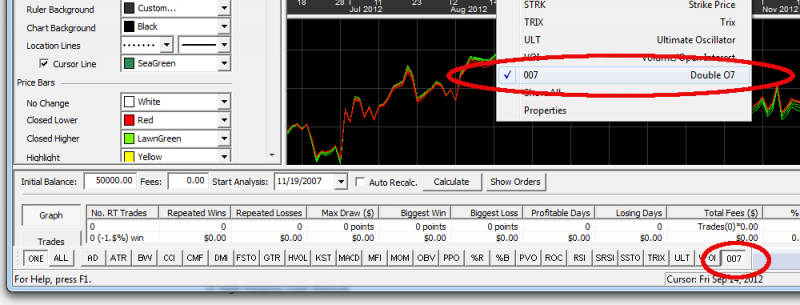
Figure 2
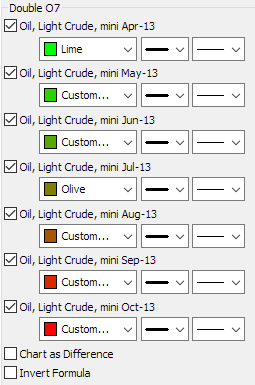
CUSTOMIZE 007
In the preference tab (figure 2) by default the next 7 available contracts after the contract month commodity you are viewing will be selected. If there are only four different contracts then all four will be selected and shown. You can change the color, line weight, and line type for each of the contracts selected.
Chart as Difference: Chart the difference in the contract prices. The contract you are viewing becomes the zero (0.00) line and each of the other contracts is charted by the difference in price from that month’s price. As the lines contract they are relatively priced close together. When they cross the zero line the market is considered inverted. (figure 3)
Invert Formula: Show the 007 indicator inverted.
Figure 3
Links
[1] http://www.trackntrade.com/tour.htm