 It’s long been said, “Where Systems Fail, Methods prevail.” This phrase has long been the standing order of business here at Gecko Software, so why now would we change our thoughts on this matter, and come out with a System Execution Autopilot Package?
Very simply put, our Autopilot is more than just a simple trading system, it was developed with the individual trader in mind, and with the mindset that trading methods are more powerful and more profitable than trading systems alone.
Traditionally speaking, a trading system has been a mechanically computerized method of buying and selling each time you receive a signal from an indicator. Most “systems” are designed around a traditional indicator and are as simple as buying each time you receive a buy signal and selling each time you receive a sell signal. This style of system trading has, in the past, proven to be the downfall of many otherwise would-be successful traders. Simply jumping into a market each time you get a buy signal and jumping back out each time you get a sell signal is a sure fire way of giving up your holdings to someone else.
It is for this purpose that we here at Gecko Software have created the Autopilot system trading platform in such a fashion that we integrate the advantages of system trading, with the advantages of method trading, allowing the Track ‘n Trade Autopilot to automatically execute your own personal trading methodology, not just a simple trading system.
If you are new to the Autopilot, it is recommended that you utilize this manual in conjunction with the Autopilot Educational Videos online. [1]
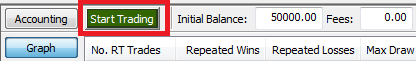
After you have set your preferences, find the green Start Trading button near the top of the Accounting/Autopilot Control Panel in the upper-left corner. Clicking on the Start Trading button will begin Autopilot trading. Trades will be placed based on the preferences you have chosen, and the buy/sell signals of the indicator(s) you have selected within the Autopilot.
Once the Start Trading button has been selected it will change to a Stop Trading button that can be used to stop your trading through the Autopilot anytime you want.
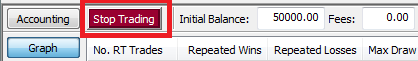
Note: After the Start Trading button has been selected, the Autopilot Tab system settings will be locked into place and you will not be able to change any Autopilot settings until after you select the Stop Trading button.
If you are new to the Autopilot, it is recommended that you utilize this manual in conjunction with the Autopilot Educational Videos online. [1]
Select the Autopilot tab in the Control Panel (the tab has a head as the icon). To read more details on these sections see the appropriate subchapters of this page.
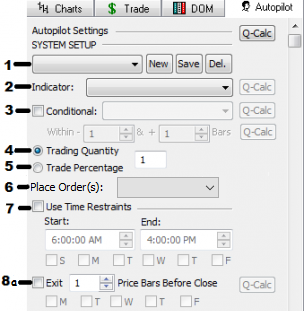 1. New/Save/Del: Save your own trading strategies here so you can use them in the future. Use the pull-down box to find previously saved strategies. Use the New start a new strategy. Use the Save button when you want to save a strategy. Use Del. button to delete your strategy.
Note: It is strongly encouraged that you, the trader, also keep a hard copy of their Autopilot settings.
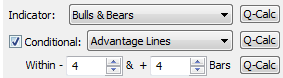
2. Indicator: Choose which indicator or system you would like to use. The indicator must have buy/sell signals notified by arrows.
3. Conditional: Add a conditional indicator or system here. If your conditional indicator throws any arrow in the same buy/sell direction as the primary indicator's latest arrow, within (-) minus bars back or (+) plus bars forward of the bar that has the primary indicators' arrow, then Track ‘n Trade will continue to evaluate whether to execute a trade.
4-5. Trading Quantity & Percentage: Number of units you’d like the trade to place or Percentage of your account you’d like to trade when the trade is placed with the max number of contracts to allow.
6. Place Order(s): Continuously - No restraints on the number of new orders placed by the Autopilot. One-Time Only - Limit the Autopilot to place only one order after selecting to Start Trading. Only one order will be placed, even if that order does not fill to become an open position. (Note: This feature is still in beta and may not be available to all customers at this time)
7. Use Time Restraints: Start time – When the Autopilot will start looking for buy/sell signals to place trades.
End time – When the Autopilot will stop trading for the day.
Days of the week – Which days of the week the Autopilot will trade.
8a. Exit Price Bars Before Close: Choose to exit open orders before the close of the day for that market.
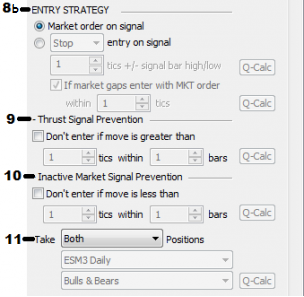 8b. Entry Strategy: Market order on Signal – Click the button to place a market entry order immediately on a buy/sell signal or confirming conditional signal.
Stop entry on Signal – This option will place a buy stop or sell stop entry order into the market at a predefined number of points (Futures) or pips (Forex) above or below the high or low of the price bar in which the signal arrow is pointing at. Market Gap MKT Order – If selected, you can specify the number of points/pips to allow for slippage if the market gaps above the original entry order. (This feature was placed in the Autopilot because if the market gaps above where the software was going to place an order the trade would have been deemed invalid and thus rejected by the broker).
9. Thrust Signal Prevention: If selected, you can specify how high, or low you are willing to allow the market to move during any single timeframe and within a specified number of price bars before allowing the Autopilot to place an entry order. This is used to prevent a fake out “thrust” from a highly volatile move from something like a news announcement.
10. Inactive Market Prevention: Activate to avoid a sideways moving market. Choose the minimum market price moved over what period of time that you require to allow a trade.
11. Take Positions / Trend: Choose if you want the Autopilot to take Long positions, Short positions, or Both positions.
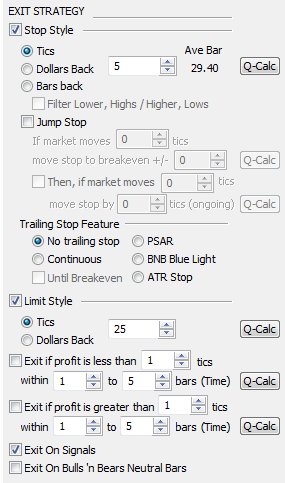
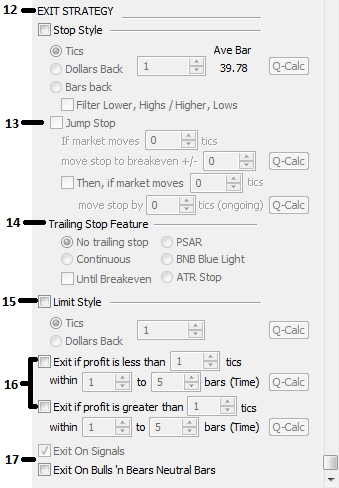 12. Exit Strategy: Choose what style of stop you want to place and where to place it. Choose from Pips/Points, Bars Back, or Dollars Back.
Ave Bar – shows the average price bar height in pips/points.
13. Jump Stops: An alteration of a traditional trailing stop, the Jump Stop will activate only after the market moves a specific number of tics/pips. The stop order will remain solitary until the market moves the amount chosen. You may create a continuous trailing stop by activating the secondary 'Then, if market moves' trigger to continue to move your stop with each new tic/pip increment.
14. Trailing Stop Features: Choose what kind of stop you’d like to place. Continuous, PSAR, BNB Blue Light, ATR Stop or No trailing stop. Turn on the appropriate indicator before using the indicator trail stops.
Until Break Even - If you select Until Break Even, Track ‘n Trade will automatically trail your stop loss order based on the entry amount listed in the previous section, until it reaches the price level of your entry order; upon reaching the same price point as your entry order, Track ‘n Trade will stop the automatic trailing of your stop order, and leave it active at the break-even price level.
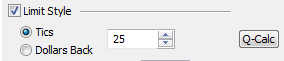
15. Limit Style: The number of pips for limit profit taking order (points for Futures).
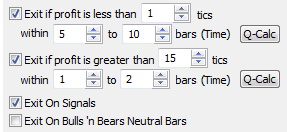
16. Exit If Feature. Exit your position if your profit is greater or less than whatever number of pips you set.
17. Exit on Signals. Close any pending or open position if a new Primary Indicator signal appears pointing in the direction opposite your position. If the Bulls 'n Bears is set as your Primary Indicator, Exit On Bulls 'n Bears Neutral Bars will close any open trade when a new Bulls 'n Bears Neutral Bar [2] appears.
Quick Calculation (Q-Calc). The Q-Calc buttons are used to locate the highest percent gain backtesting results available for each section of the Autopilot Control Panel.
Track 'n Trade has two different methods of saving. The primary method is to use the standard "Save" command within Track 'n Trade, which can be accessed by either clicking on the File drop-down menu, and selecting Save, or Save As, which gives you the option of saving your complete book for later retrieval; of course, clicking on the floppy disk icon from the button bar will also allow you to save your file to disk. Each file you save will contain all open charts and all settings for those open charts.
The second method of saving is for saving the Autopilot settings individually. This save method is located within the Autopilot windows itself, and although saving a book file as mentioned before will also save all the associated autopilot settings for each chart, this method of saving is used for the purpose of saving autopilot settings that can then be applied to any other individual chart.
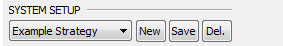
The first item listed in the Autopilot control panel is the control that allows us to save and retrieve your Autopilot Settings. If you've not saved any system settings, this drop-down box will be empty. Very simply, once you’ve selected all of your settings in the Autopilot, you can save those settings by clicking the "New" button. Once you click the New button, you receive a box where you then name your strategy. You can also click the "Default Strategy" button, which will make this strategy the one that opens up as the default for each new open chart. If you make any changes, simply hit the "Save" button and it will save the new changes, and of course, clicking the Delete button will delete the saved profile.
*Important* The System Setup section will not save the indicator settings used within the chart window. You will need to write this information down to manually enter in your indicator values when opening saved system strategies. To save your complete Autopilot settings along with your open charts and indicator values, save your work through the Track 'n Trade File menu > Save.
Autopilot steps taken before creating a trade:
After all these user-defined filters agree, only then will the Autopilot create a new order to enter the market.
The indicator drop-down list provides you with a list of available indicators for the active chart. If this box is blank or does not have the indicator that you want, it’s because you have not yet turned on the indicator from within Track ‘n Trade for the selected chart.
To turn on an indicator within Track ‘n Trade, right click on the screen, and click “Chart Overlay,” or “Add Indicator Window.”
To change the settings of an indicator, click the “Preferences Tab.” If the settings pertaining to your particular indicator are not displayed, then simply click on the indicator in the lower panel, or click the preferences tile in the lower right corner of the price column, any changes made to the indicator will be immediately reflected in the Autopilot’s lower statistical performance analysis window.
You can also select a “Conditional Indicator” from its corresponding drop-down menu. Again, it must be active on the selected chart before it will appear in the analysis window; any indicator within Track ‘n Trade that creates buy/sell signals in the chart can be used as a “Conditional Indicator.” The rule for applying the conditional indicator to your trading strategy is as follows:
If your conditional indicator creates any arrow in the same buy/sell direction as the primary indicator's latest arrow, within (-) minus bars back or (+) plus bars forward of the bar that has the primary indicators' arrow, then Track ‘n Trade will proceed with determining whether to execute a trade.
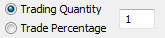
1. You can specify a single number or quantity that you want to trade.
2. You can choose to have the computer calculate a quantity, based on a margin percentage of your overall trading account and available margin.
By pressing the first radio button, labeled Trading Quantity, you are presented with a field asking for the quantity that each trade should use upon execution.
By pressing the second radio button, labeled Trade Percentage, you are presented with two fields. One field asks the percentage of the overall account the trader wants to risk on any individual trade, and the other asks for the maximum number of contracts that any one trade should ever use. Let’s say you enter 25%, with a 10 Max, the Autopilot will calculate how many contracts or lots you can trade based on a 25% risk factor of your account; Once your quantity calculation exceeds 10 contracts or lots, Track ‘n Trade will limit the number to 10.
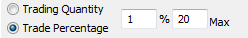
Example: Let’s say you have a $25,000.00 trading account. If you choose to limit your risk to 25% of your account, and one contract has a margin of $500.00, then 25% of $25,000.00 is $6,250.00, therefore Track ‘n Trade will execute your trades using a quantity of 12. A quantity of 12 is used because $6,250.00 divided by $500.00 is quantity 12.5. As your profits increase or decrease, Track ‘n Trade will scale the trade quantity, up or down, automatically.
Remember, this number is calculated for each individual chart. If you are trading multiple markets simultaneously, from within the same account, you’ll want to also make that a consideration in your percentage decision.
Time Restraints are used to specify a time when the Autopilot will and will not take trades.
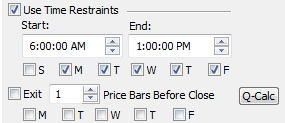
By specifying a Start Time, you are telling the Track ‘n Trade Autopilot to begin taking trades at or after the specified time.
By specifying an end time, you are telling the Autopilot when to stop taking new trades.
By selecting the days of the week, you are telling the autopilot which days you will accept new trades.
NOTE: just because you told the Autopilot not to accept new trades on a specific day, or time, does not mean that the autopilot stops trading. The Autopilot will continue to manage all open trades, during these timeframes.
Exit X Price Bars Before Close specifies when we want the Autopilot to actually close out trades. By specifying a number in this field, which can be Q-Calc’ed to help make the best determination, you are telling the Autopilot to calculate the best number of price bars prior to the close to exit the trade.
For example, if you were trading a five-minute chart, and you specified that you wanted to exit five price bars prior to the close of the market, you would be exiting the market 25 minutes prior to the close.
FOREX SPECIAL NOTE: Although Forex is traded 24 hours a day, it actually does have a close time of 5:00 pm Eastern time, therefore if you turn on this feature within Forex, it will exit your trade X number of price bars prior to 5:00 pm Eastern.
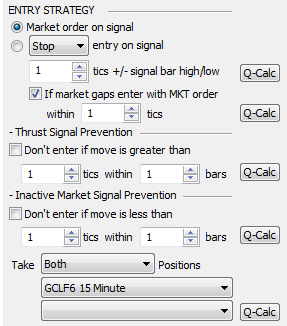
This Autopilot section will determine how you enter the market after an entry signal has been received.
Review the next four manual pages for a detailed description of each Entry Strategy section.
Market Order On Signal: The Autopilot will execute an 'at the market' entry order immediately upon receiving a buy or sell signal from your chosen indicator.
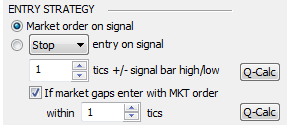
Stop Entry On Signal: Will create a buy stop or sell stop order into the market at the user-defined number of tics/pips above or below the signal price bar close.
For Example: If you have selected stop entry on signal and you have placed a 3 in the tics/pips field, upon receiving a buy signal, Track ‘n Trade will automatically place your buy stop entry order three tics/pips above the close of your signal price bar.
Advantages and disadvantages to using a Stop entry order:
Limit Entry On Signal: Will create a sell limit or buy limit order into the market at the user-defined number of tics/pips above the signal price bar close for a sell limit order or below the close for a buy limit order.
For example: If you have selected a limit entry order on signal and you have placed a 3 in the tics/pips field, upon receiving a buy signal, Track ‘n Trade will automatically place your buy limit entry order three tics/pips below the close of the signal price bar.
Advantages and disadvantages to using a Limit entry order:
MIT (Market If Touched) Entry on Signal [Futures Only]:
If market gaps enter with MKT order within X tics/pips: There is a chance that the market may gap over your specified stop/limit entry price. This filter states that if the market gaps beyond your stop/limit entry price within so many tics/pips, then enter instead with a market order. If the market gaps over your entry price beyond your specified allowable tics/pips, the Autopilot will not place the trade.
Just like an engine has a governor to keep it from revving too fast, the Autopilot has a Thrust Bar Regulator. If the market revs up too high, the Thrust Bar Regulator will keep the Autopilot from entering the market. You’ll often time hear technical analysts refer to this phenomenon as the market having moved too far too fast.
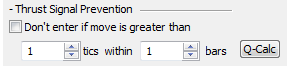
If selected, you can specify how high, or low you are willing to allow the market to move during any single timeframe and within a specified number of price bars before allowing the autopilot to place an entry order.
For example, sometimes news events will radically move a market too far too fast, making it unwise to enter the market. Therefore this setting allows Track 'n Trade to monitor the market for just such an event, and if the market price jumps radically higher or lower, and gives what I call a "long-bar," and your chosen indicator then throws a buy or sell arrow at the top or bottom of that thrust bar, the Thrust Bar Regulator will keep the Autopilot from placing an order to enter the market.
This highly effective tool also includes a Q-Calc. button to help determine the best setting for your given market and strategy.
It's often said that the markets can go one of three directions, it can go up, it can go down, or it can go sideways. If the market goes up we want to buy, if the market goes down we want to sell, but what do we do if the market is going sideways? The Inactivate Market Signal Prevention will specifically filter out these sideways moving markets.
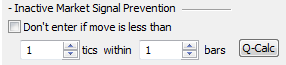
If you find that a market is trading within a small price range, and not actively trending upward or down, you may use this filter to avoid placing trades during this time. We can tell the Autopilot to not place any new trades if the market has not moved at least so many tics/pips within so many price bars.
By selecting "Trend" from within the drop-down menu, you also have the ability to allow the computer to determine a directional bias by adhering to a specific indicator's arrow on another chart of your choosing.
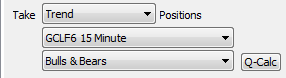
On your chosen Trend chart, your chosen Trend indicator's most recent arrow tells Autopilot to only take market long and short positions in that same direction, even though Autopilot is trading on a different chart.
Example: If you choose Trend in the first drop-down menu, the second and third drop down menu’s become active.
In the second drop-down window, you see a list of all the active charts. Select which chart you want to use to determine the overall long-term trend. Once the chart has been selected, the third drop down window will display each of the indicators available for use on that particular chart. Choose the trend indicator of your choice, and the Track 'n Trade Autopilot will then only trade the trend, based on your selection.
One such strategy would be to trade the five-minute chart, but to use a 25 and 50-period moving average crossover from the 30-minute chart to determine the trend. When the market is trading above the 30 minutes 25 and 50-period moving averages, we only take long positions on the five-minute chart, and when the market is trading below the 30 minute 25 and 50-period time frame, we only take short positions on the five-minute chart.
This section will determine how Autopilot exits the market based on many customizable filters and trade exit settings.
Exit strategy includes:
Review the next three manual pages for a detailed description of each Exit Strategy section.
Initial Stop Placement:
The Track 'n Trade Autopilot offers three different Stop order styles: Tics when trading Futures, Pips when trading Forex; Bars Back; and Dollars Back. The same quantity field is used for each of these styles.
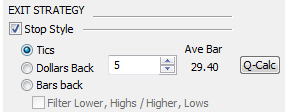
If you select Tics/Pips, then enter how many tics or pips you would like Track 'n Trade to place your initial stop order behind the market.
If you choose Dollars Back, enter the dollar amount you want Track ‘n Trade to calculate for the initial placement price of your stop order.
If you choose Bars Back, then enter the number of price bars you want Track 'n Trade to count back, and place your initial stop order. The order will place at the high or the low price of that bar (high if you are in a short position, low if you are in a long position). Notice that you can add extra tics/pips to that high/low price by entering a value to the right of the decimal point (like 3.6 is 3 bars back high/low price plus 6 tics/pips).
Filter Lower, Highs/Higher, Lows: We also have a filter associated with the Bars Back selection. This filter tells Track 'n Trade to only advance an auto-trailing stop if the price bar makes a higher high, on a long position, or a lower low on a short position.
Example: If we are in a long position, and we've chosen to automatically trail the market with a five bar back stop, and the market makes three advancing bars, with higher highs, and then three bars where the highs are not consistently higher than the previous price bar, then Track 'n Trade would hold its position, without advancing the trailing stop.
Upon receiving a sixth price bar, with a higher high, Track ‘n Trade would then advance the auto trailing stop to the lowest tic/pip counting five price bars back.
Jump Stop:
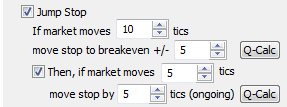
A jump stop is a stop order that has a condition on it, whereas when the condition is met the stop moves to break even or +/- x pips/tics.
The condition: When the profit is (If market moves) >= the specified x pips/tics.
Then, if market moves (Trailing jump stop): This works similar to the jump stop but just repeats. First you must have the first jump stop condition to have been met and then this will be activated to move(trail) the stop X pips/tics when the profit goes an additional Y pips/tics profit.
Trailing Stop:
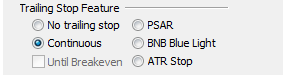
The first radio button labeled "No Trailing Stop," means that Track 'n Trade will not advance the stop loss order beyond its initial placement price.
The second radio button labeled "Continuous" tells Track 'n Trade to automatically advance the stop loss order based on the entry amount listed in the previous "Stop Style" section.
For example, with each price advance of the market, Track 'n Trade would also advance the trailing stop, maintaining 10 points, or pips back from the highest, or lowest price level achieved. If the market then falls back within 10 points or pips, to say 8 points or pips, then Track 'n Trade would hold the stop at that level until the market begins to advance once again. Of course, if the market retraces a full 10 points or pips, then the stop order would be executed and you would be out of the market.
The Track 'n Trade Autopilot also has the ability to automatically trail the stop loss order based on several indicators which have specifically been designed to help maximize the stop loss order profit potential. Before using these turn on the indicator on the chart. The first is the PSAR [3], or Parabolic SAR, which stands for Stop & Reverse, the second is the Bulls 'n Bears Blue Light [2] System, and the third is the ATR Stop [4] or Average True Range. All three stop loss order systems work on the same basic principle, other than the fact that the Blue Light System has been mathematically, and hyperbolically linked into the Bulls 'n Bears Red Light, Green Light formulas, and are automatically calculated from within the Bulls 'n Bears system; whereas the PSAR and the ATR stop systems are user definable.
When one of these three auto-trailing stop systems are selected, Track 'n Trade will automatically place the stop-loss order at either the initial price level specified previously, such as 5 price bars back, or on the first price point of the selected system; whichever is closer to the market.
For example, if you specify the initial placement of the stop-loss order to be five price bars back, yet five price bars back is actually closer to the market than the initial point of the PSAR, Track 'n Trade will place the stop order five price bars back, then wait to begin trailing the stop loss order until the PSAR stop price point has surpassed the initial five bar back level. This will be the same behavior for all three mathematically calculated stop systems.
The next selection is "Until Break Even." If selected, Track 'n Trade will automatically trail the stop loss order based on the selection until it reaches the price level of the entry order; upon reaching the same price point as the entry order, Track 'n Trade will stop the automatic trailing of the stop order, and leave it active at the break-even price level.
A limit order is an order designed to take you out of the market once a certain profit level or target price has been obtained. You can choose to place your limit orders either by points, when trading futures, or by pips, when trading Forex, or by dollars.
For example, if you wanted to take profits each time your order reached a profit level of $250.00, you would place $250.00 in the field provided, and Track 'n Trade would automatically place a limit order to take you out of the market once you reached that goal.
It's important to note, that all stop and limit orders placed from within the Track 'n Trade Autopilot system are done using OCO or One-Cancels-Other-Orders, therefore whenever your stop-loss order is hit, Track 'n Trade will automatically cancel your limit order, or if your limit order is hit, Track 'n Trade will automatically cancel your stop loss order.
It's also important to note, that when Track 'n Trade automatically places an order, you will see the graphical representation of the order tools, and the actions taken directly on the chart. Of course, you as the "Pilot," or trader can intervene at any time, and make manual adjustments to your trade by dragging and dropping orders to a different price level or exiting the position altogether. If you do make manual modifications to the system, this does not disengage the autopilot. Track 'n Trade will continue to monitor the market and make trades based on the rules specified within the Autopilot control panel. If you want Track 'n Trade to stop monitoring the market and to stop trading, you must press the "Stop Trading" button.
This section is used to close out an open trade early, if it is profit/loss meet specific values after so many price bars (time), or if a reversal primary indicator signal or Bulls 'n Bears neutral bar appears.
First start by picking a Futures contract or Forex pair and a timeframe, then choose a trading system (any indicator that produces buy/sell signals).
Futures Note: For Futures choose a start analysis time in the Autopilot backtest by going to the daily chart and looking up the Volume indicator to see when the volume moved from the previous contract month to the current contract month you have chosen. This is so you can get a realistic picture of trading. (i.e. When your current month would have started trading).
Forex Note: Before opening a book, make sure to delete your cache. Go to “Manage Local Cache” under the “File Menu” and move the intraday history slider up about half of the way so you will be able to look at more history. After that, choose a start time of approximately three months prior to the current date.
Using the Global Quick Calculation (Q-Calc) button at the very top is a good place to start. By using the Global Q-Calc button the Autopilot will automatically calculate each individual setting that is turned on. To get the best overall picture please have each box on the Autopilot Control Panel checked, so that the Global Q-Calc button can optimize each individual setting for the highest profitability.
After global optimization is done, you will be able to check and uncheck different settings on the Control Panel to further optimize your profitability. By looking at your Autopilot Profit/Loss Column (P\L $) you will be able to see if your profit goes up or down depending on the settings that are checked or unchecked.
Next, continue optimizing by clicking each button. The individual Q-Calc buttons are used to optimize profitability for each individual setting. When re-optimizing settings individually the Q-Calc will always arrive at the most profitable setting or it will change nothing. Use specific ranges to narrow your optimizations with the Q-Calc buttons. You may change ranges by right-clicking on each Q-Calc button. If your starting value is outside of your range and it has a better result than those within the range, the Q-Calc result will default back to your starting value.
You may specify the Q-Calc Range for each individual Q-Calc button. Right-click a Q-Calc button to view the range used by the Quick Calculation. The Q-Calc Range will display which specific value range the Q-Calc is searching through for the highest gain.
As an example: If you are running the Q-Calc for a Stop Style and you would like your stop to risk no more than $300 for any one trade, right-click the Stop Style Q-Calc button and set $300 as your maximum value to risk. The Q-Calc will not search for any stop loss values higher than $300.
Note: The Q-Calc buttons may take a while to process information, especially when using the Global Q-Calc button. It is recommended that you do not run other programs, or minimize the Track ‘n Trade window, while the Global Q-Calc is calculating.
Note: Saving your progress in intervals is also recommended, in either a book or with the Autopilot save feature. This will ensure that you always have an up-to-date saved version of your Autopilot settings.
*Important Note*: While the Q-Calc buttons are there to speed up the process of finding a winning system, you should not rely on them as the absolute best. There are millions of possibilities and one small change in any setting can cause dramatic changes in the overall picture.
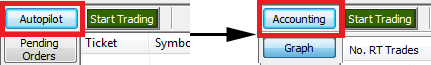
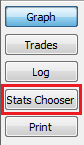
Toggle Autopilot Performance Analyses Screens
In the lower left corner is where the controls are located in the accounting portion of Track ‘n Trade. The Autopilot button is a two-state button that controls which “view” you are looking at. If you press the Autopilot button, you’ll notice that it switches the screen to reveal the autopilot performance analysis screens. Also note that the button now says, "Accounting." If you click the same button again, it flips you back over, revealing the current markets accounting information.
This section mainly deals with backtesting the Autopilot. However, the Logs section records the Forward test (running the autopilot) log notes.
The back testing values can be found right below the chart window.

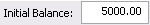
Initial Balance: Enter the amount you would like the Autopilot to start calculating from.
Fees: Enter in any trading fees you'll have for Futures. For Forex this should usually be $0.00 because the commission is included in the spread.

Start Analysis: The starting month, day, year, and time you would like the Autopilot to backtest from.

End On: The month, day, year, and time you would like the Autopilot to stop calculating.
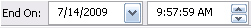
Auto Date: Will automatically update your End On analysis date to the current date and time.

Auto Recalc: With this checked the backtesting calculations will change on the fly as you change your settings.

Calculate: This button is only available when the Auto Recalc is not checked. Use this to manually calculate backtest settings.

No. Trades: Number of trades the Autopilot would’ve placed in the allotted time.
Repeated Wins: The greatest number of winning trades in a row. Total positive (+) dollars.
Repeated Losses: The greatest number of losing trades in a row. Total negative (-) dollars.
Max Draw: Longest draw down without hitting a stop.
Biggest Win: The most profitable trade placed within the time period set.
Biggest Loss: The least profitable trade that went into negative dollars within the time period set.
Profitable Days: How many profitable days you’ve had on the Autopilot within the time period set. Days that had a total of positive (+) dollars.
Losing Days: How many losing days you’ve had on the Autopilot within the time period set. Days that had a total of negative (-) dollars.
Total Fees: Calculates the total of the trading fees.
Percent Gain: The percentage gain on your account within the time period set.
Closed P/L: The profit/loss of closed charts.
Open P/L: The profit/loss of charts currently opened.
Total P/L: Total profit/loss from your trades with the Autopilot.
Equity Performance Graph
Clicking the Graph button will bring up a line graph on the bottom-half of your screen that will allow you to see how your Autopilot settings would have done over any given period of time (as set in dates listed by the user).
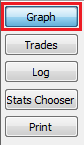
By right-clicking in the graph window, you receive a right-click menu, where you can make visual adjustments to the chart. You can select whether you would like to see the graph displayed as a line or histogram, whether the line chart is filled, and if you want to exclude the initial balance (Profit/Loss Only).
Clicking the Trades button will bring up a spreadsheet on the bottom-half of your screen to show all the details of each trade that has been placed with the Autopilot.
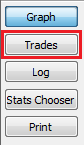
You’ll see each trade as they would historically have been executed from the current settings within the autopilot. In this list, you'll see each trade, whether it was a buy or sell, the entry and exit times, the profit and loss, fees and balances.
You'll notice that we have a column labeled "Daily Realized" that is that days profit or loss color coordinated.
By double-clicking on any single trade listed in the table, Track ‘n Trade will automatically center that trade on the screen, and highlight the buy or sell signal that generated that trade.This is helpful in analyzing individual trades, to see what adjustments might be made to the system, to help the statistical performance.
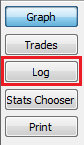
This log is used to analyze the live trading performance, allowing you to see each step taken by the system, and Track ‘n Trade's interaction with the market, and what intervention was taken by the user. This log is used for auditing the system to make sure it’s doing exactly what we expected.
*Important* If you find that a signal appeared in your chart but the Autopilot did not place a new trade, check the time of the signal in your chart, open the Log and scroll to that time. The Log will tell you which of your personal filters or Autopilot settings filtered out that particular trade entry.
This is where you find all the performance statistics for the Autopilot system and settings. In this row you'll find such things as the number of trades and percentage that were winners vs. losers, you'll find repeated wins, losses, and their calculated ratios. You'll find biggest winning trades, biggest losing trades, as well as a number of other statistical results based on your chosen settings.
This row of statistics can be modified by right-clicking on the header and selecting "Column Setup" from within the right-click menu. This action will open a window that is full of different analytical results, choose just your favorites, or choose them all.
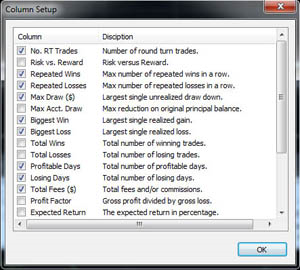
| Column Setup Options | |
| Column | Description |
| No. RT Trades | Number of round turn trades |
| Risk vs. Reward | Risk versus reward |
| Repeated Wins | Max number of repeated wins in a row |
| Repeated Losses | Max number of repeated losses in a row |
| Max Draw ($) | Largest single unrealized drawdown |
| Max Acct. Draw | Max reduction on original principal balance |
| Biggest Win | Largest single realized gain |
| Biggest Loss | Largest single realized loss |
| Total Wins | Total number of winning trades |
| Total Losses | Total number of losing trades |
| Losing Days | Total number of profitable trades |
| Total Fees ($) | Total fees and/or commissions |
| Profit Factor | Gross profit divided by gross loss |
| Expected Return | The expected return in percentage |
| Return Volatility | Standard Deviation (Sigma) Return Volatility |
| Sharpe Ratio | The expected return divided by Volatility |
| Trades Needed | The trades needed to be 99.9% accurate |
| % Gain | Percent gain from initial balance |
| Closed P/L ($) | Closed or realized profit or loss |
| Open P/L ($) | Open or unrealized profit or loss |
| Total P/L ($) | Total profit or loss |
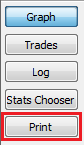
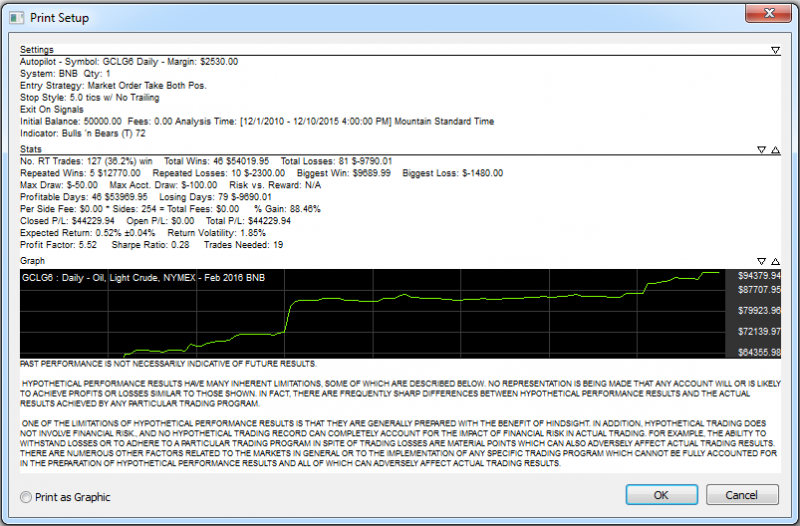
Pressing the Print button pulls up a visual report of all the settings that were used in the creation of this particular Expert Advisor, or trading strategy. Notice at the top, you have listed all the Autopilot settings, the stats for this trading strategy, the equity chart, and each individual trade for the timeframe specified that created this equity graph and return on our investment.
This report can be saved as a graphic by selecting this "Print as Graphic" radial button and pressing ok, or you can leave the radial button blank and print the report to your printer.
Links
[1] http://www.trackntrade.com/support/videos/autopilot/
[2] http://education.trackntrade.com/node/1308
[3] http://education.trackntrade.com/node/1301
[4] http://education.trackntrade.com/node/1814