
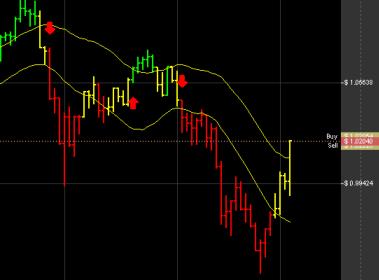
With the Bulls ‘n Bears Red Light, Green Light, Blue Light trading method/system you have simple to understand entry and exit signals displayed visually on the chart.
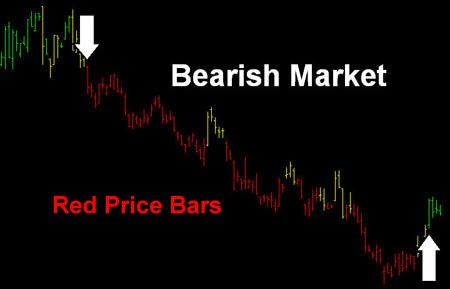
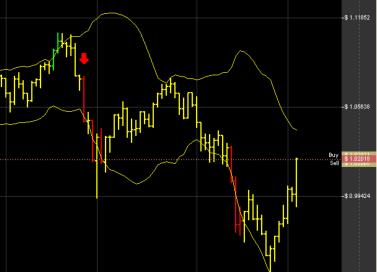
Indicates the beginning of a bearish trend, and that the contract has started to move downward, identifying a possible short entry point.
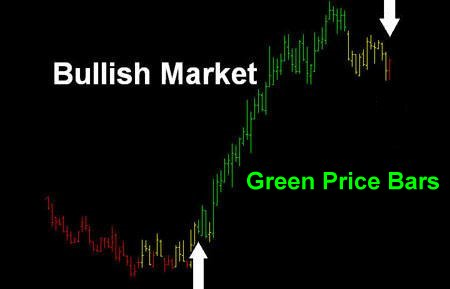
Indicates the trend of a market has begun to move upward, identifying a possible long entry point.
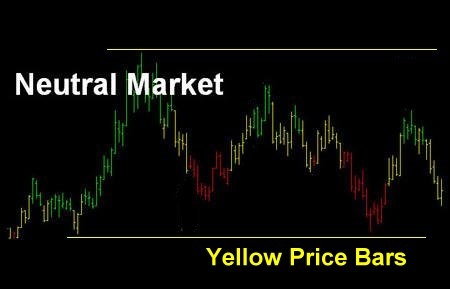
Indicates the trend of the market has entered a sideways or neutral time frame.
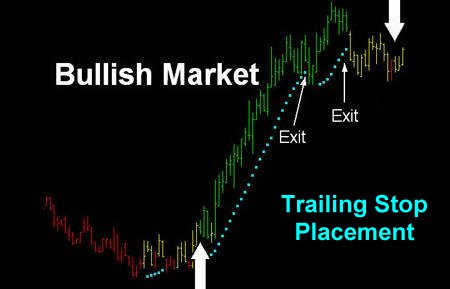
The Parabolic stop is used within the Bulls ‘n Bears system as the key point for managing your stop loss risk while trading, helping you to identify exit and stop loss placement points after entering a trade.
1. Restore Settings: TNT Default will change your settings back to the original software settings. My Default will change current settings to your personalized default settings. Apply To All Charts will apply your selected settings on all open charts. Save As My Default will save your current personal settings.
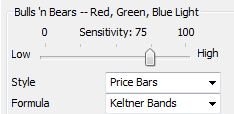
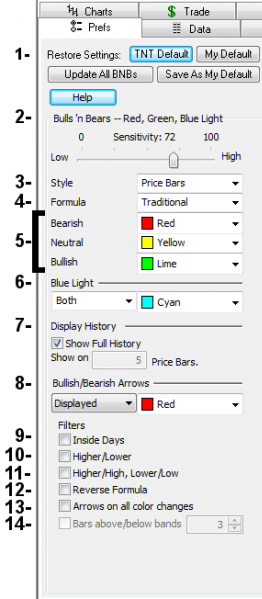 2. Sensitivity: A higher sensitivity will give you earlier bullish/bearish arrows, while a lower sensitivity will wait to give you the bullish bearish arrows until a trend is established.
3. Style: Choose the price bar style you want to view on your chart.
4. Formula: A Traditional style will widen the neutral (yellow) positions and is a more conservative approach. A Progressive style will narrow the neutral positions, and an Aggressive style will eliminate the neutral positions on your chart. Bollinger Bands, Keltner Bands, & 10x8 MAC are incorporated into the Bulls 'n Bears Proprietary formula so that they generate individual buy & sell signals. When selecting these three indicators the settings will appear in the preference dialog box.
5. Bearish/Neutral/Bullish: You can change the color of the Bearish, Bullish, and Neutral price bar indicators.
6. Blue Light: The blue light indicates where to place your stop loss. You can choose to display them only on the bullish or bearish side of the market, both sides, or not at all. You can also change its color.
7. Show Full History: To view the bullish/bearish tendencies on all the price bars on your chart, check the box. To limit the bullish/bearish tendencies to a specific number of price bars at the end of a chart as well. Uncheck the box and enter the number of price bars you would like to view.
8. Bullish/Bearish Arrows: Choose to display or not to display the Bullish/Bearish arrows and select the color of the arrows.
9. Inside Days Filter: Excludes taking into consideration inside days/price bars when calculating bullish/bearish, buy/sell arrows. (An inside day, or inside price, is a price bar where the high of the bar is lower than the previous price bar high, and the low of the bar is higher than the previous price bar low.
10. Higher/Lower Filter: Excludes taking into consideration price bars which have a lower close than its open when calculating a bullish/buy arrow, and a higher close than its open when calculating a bearish/sell signal. (Price bar closed :higher than it opened.) (Price bar closed “lower” than it opened.)
11. Higher/High, Lower/Low Filter: Excludes taking into consideration price bars that do not have a higher close than the previous price bars high for bullish/buy signals, or excludes price bars that do not have a lower close than the previous price bars low when calculating bearish/sell signals. (Close “higher” than previous price bar “high.”) (Close “lower” than previous price bar “low.”)
12. Reverse Formula: This option reverses the buy/sell signals. Changing a buy signal to a sell signal and a sell signal to a buy signal
13. Arrows on all color changes: Selecting this option will place a buy/sell signal anytime the Bulls 'n Bears color changes.
14. Bars above/below bands: The buy/sell signals for the Bollinger Bands, Keltner Bands, and the 10x8 MAC will be adjusted based on how many bars above or below the bands. For example, if you are looking for a buy/sell signal on the Bollinger Bands and want it to be 3 bars above or below bands prior to generating a signal then the tic/pip/bar must close above or below the upper/lower limit three consecutive times before a signal is generated.
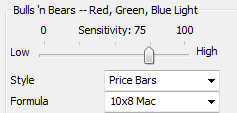 A buy signal is generated when a complete price bar, open/high/low/close appears above the upper 10x8 Band, also, that bar, along with any subsequent bar that maintains a complete open/high/low/close above the upper 10x8 Band is colored green.
A sell signal is generated when a complete price bar, open/high/low/close appears below the lower 10x8 Band, also, that bar, along with any subsequent bar that maintains a complete open/high/low/close below the lower 10x8 Band is colored red.
A neutral market, according to the 10x8 MAC, is identified by price bars that close between the upper and lower bands, and are colored yellow.
The Bollinger Bands have been added to the Bulls ‘n Bears to integrate the advanced capabilities of the Bulls ‘n Bears with the Bollinger Bands. By doing so, we now have the ability to throw buy/sell signals, using a combination of the Bulls ‘n Bears red/yellow/green light system to the Bollinger Bands.
Here are the rules:
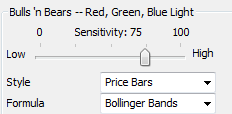 A buy signal is generated when a price bar closes above the upper Bollinger Band, also, that bar, along with any subsequent bar that closes above the upper Bollinger Band is colored green.
A sell signal is generated when a price bar closes below the lower Bollinger Band, and, that bar, along with any subsequent bar that closes below the upper Bollinger Ban is colored red.
A neutral market, according to the Bollinger Bands, is identified by price bars that close between the upper and lower bands, and are colored yellow.
The Keltner Bands have been added to the Bulls ‘n Bears to integrate the advanced capabilities of the Bulls ‘n Bears with the Keltner Bands. By doing so, we now have the ability to throw buy/sell signals, using a combination of the Bulls ‘n Bears red/yellow/green light system to the Keltner Bands.
 A buy signal is generated when a price bar closes above the upper Keltner Band, also, that bar, along with any subsequent bar that closes above the upper Keltner Band is colored green.
A sell signal is generated when a price bar closes below the lower Keltner Band, and, that bar, along with any subsequent bar that closes below the upper Keltner Band is colored red.
A neutral market, according to the Keltner Band, is identified by price bars that close between the upper and lower bands, and are colored yellow.
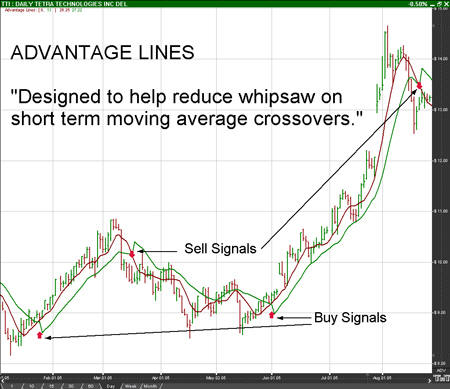
The proprietary Advantage lines, included in Bulls 'n Bears Trading System plugin, have been developed to help eliminate whipsaw versus a typical short-term type moving average trading system. The main advantage of a typical short-term moving average trading system is that it provides early entry signals to potential trading opportunities and trend reversals. This is also the disadvantage to the same type system as it can have whipsaw or a "head fake". Advantage lines were engineered to give the best of both worlds - early entry signals and avoid whipsaw.
Signals:
Buy and sell arrow are thrown when the lines cross. In the example above, a buy arrow is thrown when the red line (Line 1) crosses above the green line (Line 2). A sell arrow is thrown if the opposite happens.
Open the Preference tab from the Control Panel on the right of your screen. Right-click on the chart, choose Chart Overlay Preferences, then Advantage Lines. Or click on the Quick Link in the lower right "ADV". The Advantage Lines preferences will appear in the Control Panel. (Once you click on the chart, the Preference tab will go back to chart settings.)
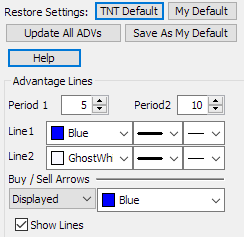 Restore Settings: TNT Default will change your settings back to the original software settings. My Default will change current settings to your personalized default settings. Apply To All ADVs will apply your selected settings on all open charts. Save As My Default will save your current personal settings.
Period 1 and Period 2: Change the period value by which each line is calculated here.
Line 1 and Line 2: Change the color, style, and thickness of the Indicator lines.
Buy/Sell Arrows: Turns the display for buy/sell arrows on or off. You also have the option to change the color of the buy/sell arrows.
Show Lines: The lines are on by default. However, the lines can be turned off to only show the arrows.
Convergence and Divergence
The most important signals are taken from the spacing between the Ribbon lines in each group, not from crossovers. When shorter-term lines (yellow) and longer-term lines (red) within a group are parallel and close together, the group are largely in agreement. When the Ribbon lines widen apart, this signals divergent views within the group. When Ribbon lines converge, this is a sign that the group view is changing.
Trend Strength: Parallel long-term Ribbon lines signal long-term investor support and a strong trend short-term Ribbon lines tend to bounce off the long-term Ribbon lines group.
Trend Weakness: Both groups of Ribbon lines converge and fluctuate more than usual.
Trend Start: A change in price direction accompanied by expanding Ribbon lines in both groups.
Short-Term Reversals: The short-term group crossover, diverge and then again converge; while the long-term group remains parallel.
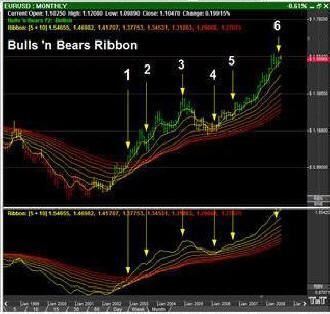
1. Short-term retracement gives an entry long signal
2. Another short-term retracement
3. Moving averages diverge, increasing the risk of a reversal
4. Strong retracement indicated changing short and medium-term views, but long-term view holds firm
5. Short-term retracement signals recovery
6. Moving averages diverge, warning of another reversal
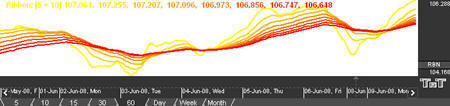
The Ribbon Indicator is unique in Track 'n Trade because it can be viewed both in the indicator window or as a chart overlay.
Open the Preferences Tab in your Control Panel. Select the RBN quick link at the right of the indicator window. (Once you click on the chart, the Preference tab will go back to chart settings.)
 Restore Settings: TNT Default will change your settings back to the original software settings. My Default will change current settings to your personalized default settings. Apply To All Charts will apply your selected settings on all open charts. Save As My Default will save your current personal settings.
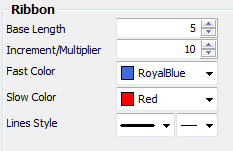
Base Length: Specify the period of the first and "fastest" moving average.
Increment/Multiplier: Specify the number by which the 7 additional moving averages periods will be incrementally calculated. This value will be added to the Base Length.
Fast Color: Specify the color of the fastest moving average line.
Slow Color: Specify the color of the slowest moving average line.
Lines Style: Choose the line style and thickness of your indicator line.
The Ribbon Overlay Indicator functions by the same principles as the Ribbon Indicator, but is displayed as an overlay in the chart window.
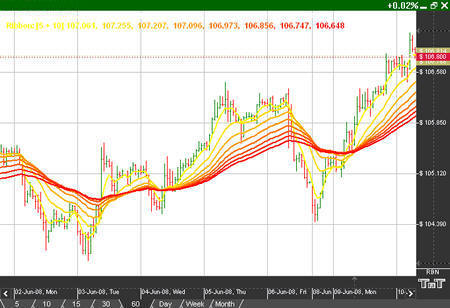
Right-click anywhere on the chart and go to “Overlay Properties.” Select Ribbon from the list. The preferences will appear in the Control Panel. (Once you click on the chart, the Preference tab will go back to chart settings.)
Restore Settings: TNT Default will change your settings back to the original software settings. My Default will change current settings to your personalized default settings. Apply To All Charts will apply your selected settings on all open charts. Save As My Default will save your current personal settings.
Base Length: Specify the period of the first and "fastest" moving average.
Increment/Multiplier: Specify the number by which the 7 additional moving averages periods will be incrementally calculated. This value will be added to the Base Length.
Fast Color: Specify the color of the fastest moving average line.
Slow Color: Specify the color of the slowest moving average line.
Lines Style: Choose the line style and thickness of your indicator
line.