- Getting Started
- Control Panel
- Toolbars
- Chart Overlay Indicators
- Indicator Windows
- COT - Commitment of Traders
- PROB - Market Probability
- RBN - Ribbon
- SEAS - Seasonal Trend
- AD - Williams Accum/Dist "Williams Accumulation/Distribution"
- ATR - Average True Range
- %B - Percent Bollinger Bands
- BW - Bollinger Bandwidth
- CCI - Commodity Channel Index
- CMF - Chaikin Money Flow
- DMI - Directional Movement Index
- FSTO - Fast Stochastics
- GTR - Gator Oscillator
- HVOL - Historic Volatility
- KST - Know Sure Thing
- MACD - Moving Average Convergence/Divergence
- MFI - Money Flow Index
- MOM - Momentum
- OBV - On Balance Volume
- PPO - % Price Oscillator
- PVO - % Volume Oscillator
- %R - Williams' %R "Williams Percent R"
- ROC - Rate of Change
- RSI - Relative Strength Index
- SRSI - Stochastic Relative Strength Index
- SSTO - Slow Stochastics
- TRIX - Triple Exponential Average
- ULT - Ultimate Oscillator
- VOL - Volume
- Plug-Ins
- End User License Agreement(EULA)
- Gecko Software Risk Disclosure
You are here
ATR Stop (ATR) "Average True Range"
Average True Range Stop ("ATR") is a modified version of the Average True Range indicator that was developed by Welles Wilder to work with the commodity industry. The purpose of the Average True Range indicator is to recognize the level of volatility in a market. The system was subsequently modified for trailing stops and now is commonly known as Average True Range Trailing Stop.
Calculation
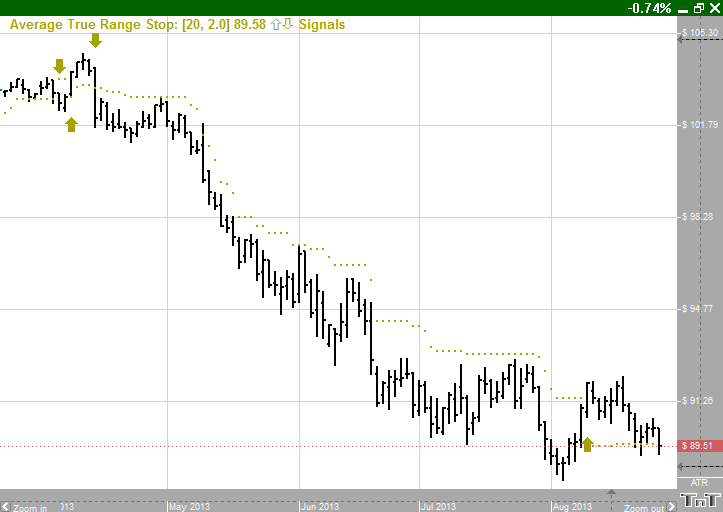
Average True Range Stop starts with Average True Range indicator calculations with a stop factor applied to it. The ATR indicator is calculated with a default period of 20 days. The ATR indicator is a moving average of the True Ranges defined below and is calculated based on the largest of the three:
Today’s HIGH to today’s LOW
Yesterday’s CLOSE to today’s HIGH
Yesterday’s CLOSE to today’s LOW
Now to calculate the stop part of the indicator we apply a stop factor to the result of the ATR indicator and add/subtract the value from the close:
close +/- (ATR value) * (stop factor)
Add or subtract (+/-) depends on whether it is trailing a buy or sell stop respectively. Know that since the value is meant to be trailing, the value will not move away from the current market price. That means if the calculation yields value that is farther away from the market then it is ignored.
Example of the Average True Range Stop

Preferences
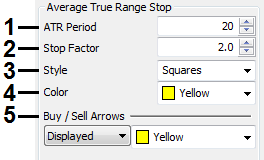
To open the Average True Range Preferences click on the QuickLink (ATR) in the lower right of the chart. Or you can right-click, select Overlay Properties and then Average True Range. If you click on the chart, the Preferences tab will go back to chart settings.
 1. Period: Specify the number of days to be used in calculating the ATR.
2. Stop Factor: This variable determines how close or how far the stop follows the market. Larger values mean that the stop will move farther away from the market and smaller values mean that the stop will move tighter to the market.
3. Style: Choose how you would like the indicator displayed. Select squares, crosses, dots, or lines.
4. Color: Select the color for the indicator which indicates where to place the stop.
5. Buy/Sell Arrows: Turns the display for buy/sell arrows on and off. You also have the option to change the color of the buy/sell arrows.
