You are here
Keltner Bands
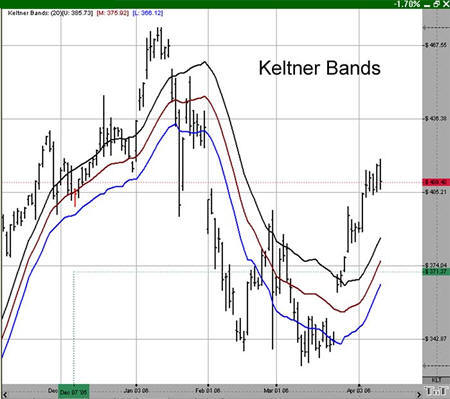
The middle line (20 period EMA) in a rising market should provide support. In a falling market, the middle line should provide resistance. Keltner Bands, as with any moving average indicator, seem to work great in strongly tending markets, but not so well in sideways markets. Just like all trend-following systems, the Keltner Bands are not meant to spot tops or bottoms. Use the Keltner Bands in conjunction with other indicators such as RSI or MACD. Using it in combination with either of these will help provide verification of the strength of a market.
Calculation
The calculation for the top, or Plus Band, is here:
2 (ATR over 10 periods) + (20 period exponential moving average)
The calculation for the bottom, or Minus Band, is here:
2 (ATR over 10 periods) - (20 period exponential moving average
Example of Keltner Bands
Preferences
To open the Keltner Bands Preferences click on the QuickLink (KLT) in the lower right of the chart. Or you can right click, select Overlay Properties and then Keltner Bands. If you click on the chart, the Preferences tab will go back to chart settings.
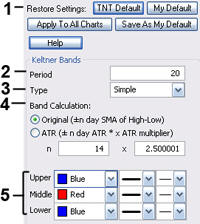 1. Restore Settings: TNT Default will change your settings back to the original software settings. My Default will change current settings to your personalized default settings. Apply To All Charts will apply your selected settings on all open charts. Save As My Default will save your current personal settings.
2. Period: Specify the number of days used.
3. Type: Select Simple, Linear Weight, or Exponential.
4. Band Calculation: Select Original or ATR and enter values of your own.
5. Upper, Middle, Lower: Choose the color, line style, and line thickness of your indicator line.