You are here
Seasonal Trends
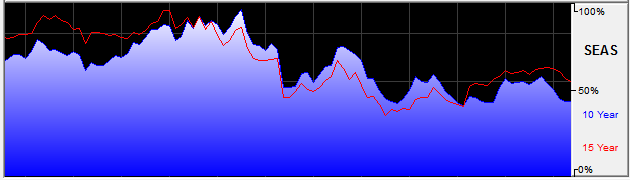
The seasonal trend indicator represents the "normal" historical behavior of the market. The indicator is calculated on the specific contract month, showing you behavior of that specific chart. This is very important in agricultural markets with new and old crop contracts, such as Wheat or Corn.
The charts depict behavior on a relative basis; the actual prices are not forecasted, just the relative position of the market versus its contract high and low. On the seasonal charts, the high is depicted as 1.0, or 100%, while the low is depicted as 0.0, or 0%. All similar trading days are lined up for X number of years (the defaults in Track 'n Trade 5.0 are 10 years for Trend 1, and 15 years for Trend 2) and are analyzed in terms of where each day falls as a percentage of the highest and lowest price of either the last 12 months or the life of the contract for each specific contract. These prices are then averaged and depicted in the indicator window. When the trend line is at 100% or 1.0, it indicates where the contract has, on average, been at its highest value for a specified time range and scale period.
When the trend line is at 0% or 0.0, it indicates where the contract has, on average, been at its lowest value for the specified time range and scale period. The averages use data from all previous years and are not affected by the current year's trend.
Displaying the Seasonal Trend Indicator
Click on the SEAS button located in your Indicators toolbar.
Preferences
Right-click on the SEAS button in your Indicator toolbar and select SEAS Settings. The Preferences Tab will open in the Control Panel and the SEAS preferences will be displayed. (Once you click on the chart, the Preference tab will go back to chart settings.)
Restore Settings: TNT Default will change your settings back to the original software settings. My Default will change current settings to your personalized default settings. Apply To All Charts will apply your selected settings on all open charts. Save As My Default will save your current personal settings.
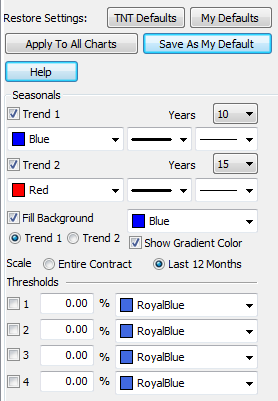
Trend 1,2: Select how many years you would like to view and what color, line thickness, and line style you would like the indicator to be. You can also choose Fill Background and choose the color and which trend you would like it to be applied to.
Show Gradient Color: Toggle off to remove gradient color shading within filled trend.
Scale: Decide if you would like the indicator to be based on the Entire Contract or the Last 12 Months.
Thresholds: View up to four thresholds at a value that you type in and a color that you choose.