You are here
Creating Long Term Charts
Because commodity contracts overlap over each other, Track 'n Trade 5.0 creates Long Term charts by placing together the data from the front month contracts. This method only shows the data for the section of the contract that is actively being traded and excludes the excess, giving the contract higher volume and open interest.
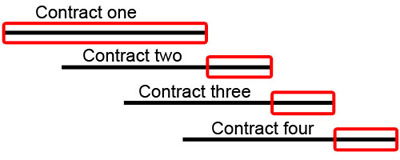
The boxes represent the portion of the contract that Track 'n Trade 5.0 uses to create the long term chart.